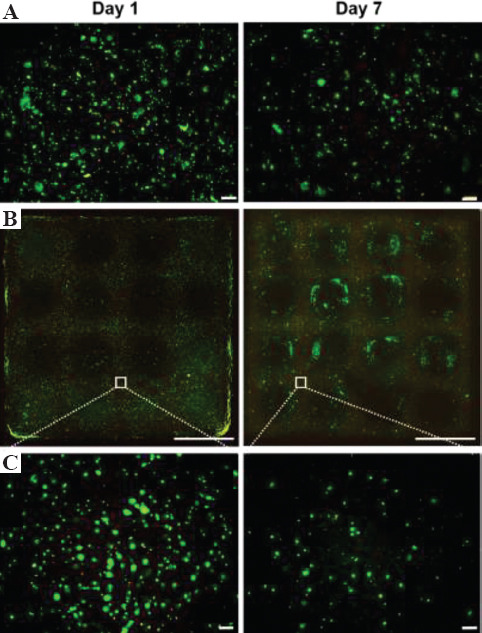
Figure 5.

Fluorescence images of 10T1/2 cells cultured in (A) non-printed and (B, C) printed hydrogels for 1 and 7 days at different magnifications. Live and dead cells show green and red fluorescence, respectively. Scale bars: (A), (C) 200 μm and (B) 5 mm.
