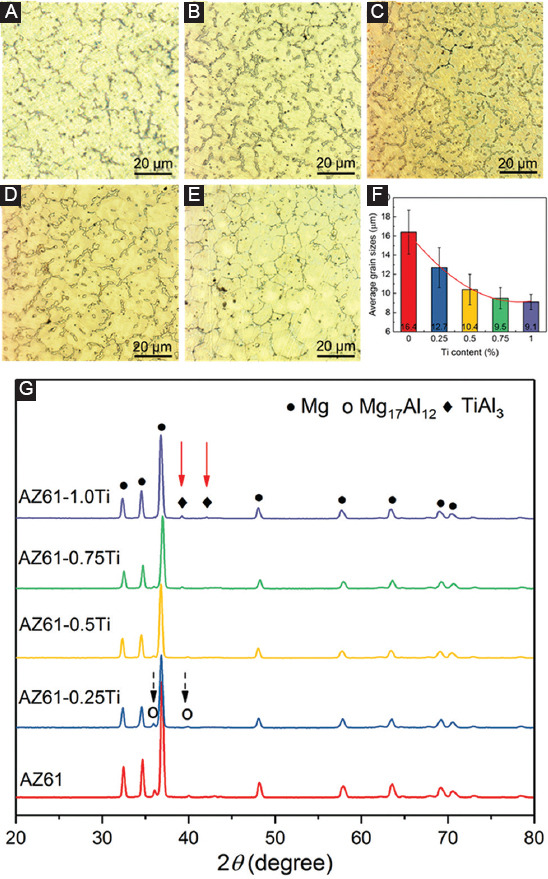
Figure 3.

Optical microstructure of (A) AZ61, (B) AZ61-0.25Ti, (C) AZ61-0.5Ti, (D)AZ61-0.75Ti, and (E) AZ61-1.0Ti. (F) The measured average grain sizes. (G) X-ray diffraction patterns of AZ61-Ti. Mg17Al12 and TiAl3 phases were marked by black dash arrow and red solid arrow, respectively.
