
Figure 9.
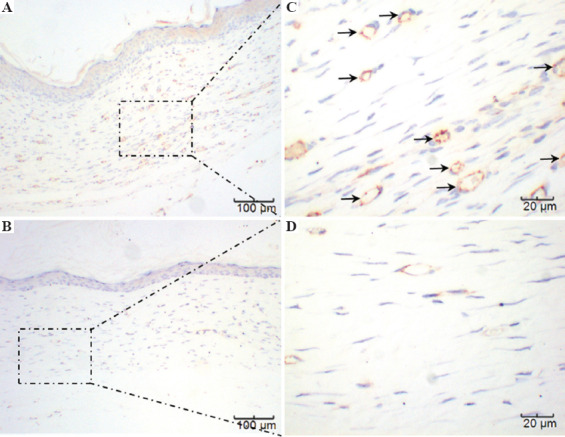
A and C represent the printed skin graft group, at ×100 and ×400, respectively. B and D represent the control group, at ×100 and ×400, respectively. Because there was no significant difference between the three control groups, only one set is displayed. The microvessels marked as brown in A and C can be clearly seen, while visible in B and D only sparsely.