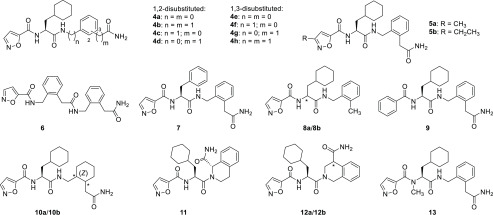
Table 1. PAR2 Agonist Activitiesa.
| Gq activation |
β-arrestin-2
recruitment |
|||
|---|---|---|---|---|
| EC50 [μM] | Emax [%]b | EC50 [μM] | Emax [%]b | |
| 4a | 3.1 ± 1.1 | 70 ± 7 | n.c.d | 6 ± 3e |
| 4b | 0.59 ± 0.10 | 93 ± 2 | 6.0 ± 0.3 | 65 ± 6 |
| 4c | 1.0 ± 0.1 | 95 ± 1 | n.c.d | 55 ± 7e |
| 4d | 11 ± 1 | 108 ± 4 | n.c.d | 8 ± 1 |
| 4e | 2.2 ± 0.3 | 105 ± 8 | n.c.d | 53 ± 10e |
| 4f | 3.3 ± 0.4 | 93 ± 1 | n.c.d | 42 ± 4e |
| 4g | 1.3 ± 0.2 | 97 ± 2 | n.c.d | 73 ± 6e |
| 4h | 2.9 ± 0.4 | 92 ± 3 | n.c.d | 41 ± 5 |
| 5a | 0.64 ± 0.19 | 105 ± 2 | 8.9 ± 0.4 | 95 ± 3 |
| 5b | 0.96 ± 0.05 | 104 ± 4 | 18 ± 2 | 93 ± 4 |
| 6 | n.a.c | <5 | n.a.c | <5 |
| 7 | 1.9 ± 0.1 | 93 ± 1 | n.c.d | 32 ± 4e |
| 8a | n.c.d | 85 ± 2e | n.a.c | <5 |
| 8b | n.c.d | 44 ± 2e | n.a.c | <5 |
| 9 | n.c.d | 9 ± 1e | n.a.c | <5 |
| 10a | 1.8 ± 0.3 | 97 ± 3 | n.c.d | 60 ± 2e |
| 10b | 0.64 ± 0.08 | 100 ± 1 | 7.4 ± 0.3 | 87 ± 6 |
| 11 | 2.4 ± 0.2 | 98 ± 5 | n.c.d | 93 ± 5e |
| 12a | 4.2 ± 0.5 | 97 ± 4 | n.c.d | 32 ± 4e |
| 12b | 4.9 ± 0.8 | 98 ± 4 | n.c.d | 33 ± 5e |
| 13 | n.c.d | 12 ± 5e | n.a.c | <5 |
| 1 | 0.15 ± 0.03 | 100 | 0.43 ± 0.05 | 100 |
| 2 | 0.17 ± 0.03 | 110 ± 4 | 2.0 ± 0.2 | 94 ± 5 |
Data are reported as mean ± SEM for at least three independent experiments performed in duplicate.
Maximum efficacy determined relative to reference 1 (2f-LIGRLO-NH2).
n.a. indicates that no activity was observed.
n.c. indicates that the dose–response curve did not converge to a plateau and an exact EC50 was not calculated.
The dose–response curve did not converge to a plateau, and the reported value is the efficacy at a ligand concentration of 30 μM.

