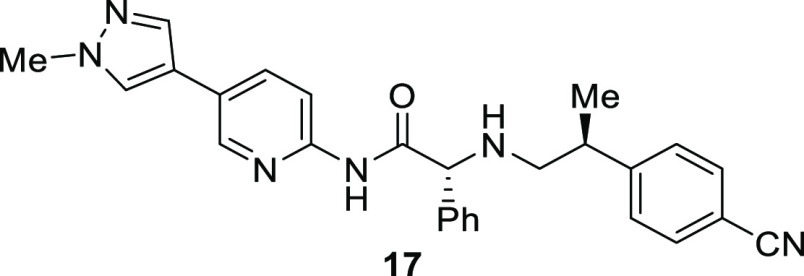
Table 2. Structure of Compound 17 and Profiles of Indole Lead 3 and Aminopyridine Analogues 12 and 17.
| compound | 3 | 12 | 17 |
|---|---|---|---|
| In Vitro Assaysa | |||
| EP300 HAT SPA IC50 (μM) | 0.040 | 0.019 | 0.0081 |
| full length EP300 SPA IC50 (μM) | 0.0025 | <0.0005 | <0.0005 |
| full length CBP SPA IC50 (μM) | 0.0032 | 0.0067 | 0.0029 |
| H3K18Ac MSD EC50 (μM) | 0.037 | 0.025 | 0.014 |
| JEKO-1 GI50 (μM) | 0.044 | 0.017 | <0.0079 |
| hERG (% inh. @ 10 μM) | 97 | n.a. | 9.2 |
| PAMPA pe (nm/s) | <0.066 | 13.8 | 11.9 |
| mouse PPB (%) | 99.1 | 98.3 | 99.1 |
| MLM Cl (μL/min/mg) | 46.6 | 215 | 178 |
| Mouse PKb | |||
| clearance (L/h/kg) | 3.49 | 2.30 | 1.88 |
| Vss obs | 1.92 | 0.88 | 0.99 |
| T1/2 (h) | 1.44 | 1.24 | 1.40 |
| F% | 43 | 88 | 47 |
All biochemical assays are the average of two or more runs. Parallel artificial membrane permeation assay (PAMPA), mouse plasma protein binding (PPB), and mouse liver microsome (MLM) assays are a single run.
Mouse PK data are derived from cassette PK experiments, using 0.5 mg/kg intravenous (IV) and 2.5 mg/kg per os (PO) doses.

