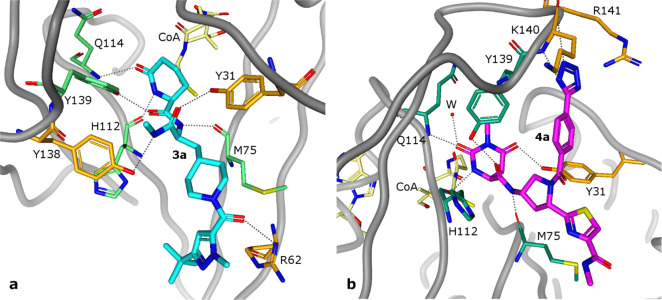
Figure 5.
Crystal structures of the complex of Naa50 with CoA and 3a (2.16 Å, PDB ID 6WFG) (a) or 4a (1.87 Å, PDB ID 6WFK) (b). CoA is drawn in yellow stick representation, 3a in blue stick representation, and 4a in magenta stick representation. Residues that form hydrogen bond interactions (dashed lines) that are common to both 3a and 4a are drawn as green sticks, while those that are unique to each ligand are drawn as orange sticks.

