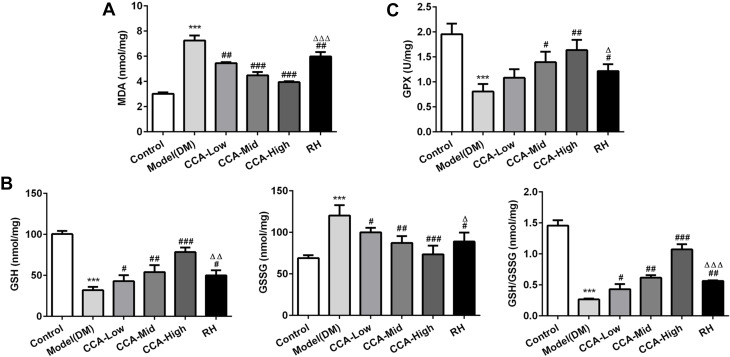
Figure 4.
The effects of CCA on MDA, GSH, GSSG and GSH/GSSG level in vivo. The MDA level in the study groups (A), the levels of GSH, GSSG and GSH/GSSG in the different groups (B); the GPX4 level in the study groups (C). ***P < 0.001 vs. control group; #P < 0.05, ##P < 0.01 and ###P < 0.001 vs. model group ; ΔP < 0.05 ΔΔP < 0.01 and ΔΔΔP < 0.001vs. CCA-high group.

