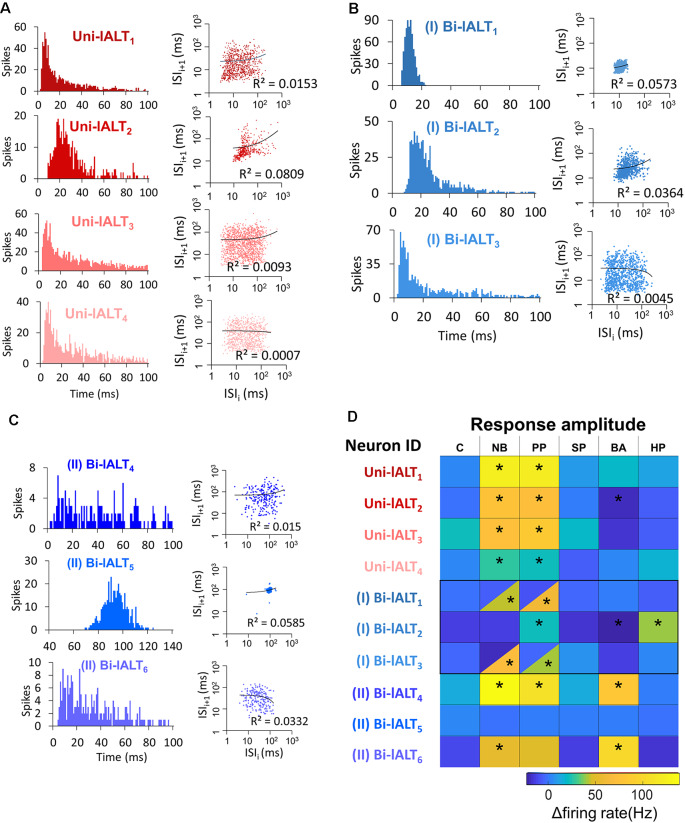
Figure 7.
Overview of distinct parameters in all recorded lateral-tract neurons. (A–C) Spontaneous firing pattern during pre-test activity, including ISI histograms and Joint ISI scatter plot. (D) Heat map of firing rate amplitudes in the 10 lateral-tract neurons. *Indicates significant response, determined according to the threshold of baseline activity of individual neurons (with 95% confidence level). C, control; NB, natural blend; PP, primary pheromone; SP, secondary pheromone; BA, behavioral antagonist; HP, host plant.

