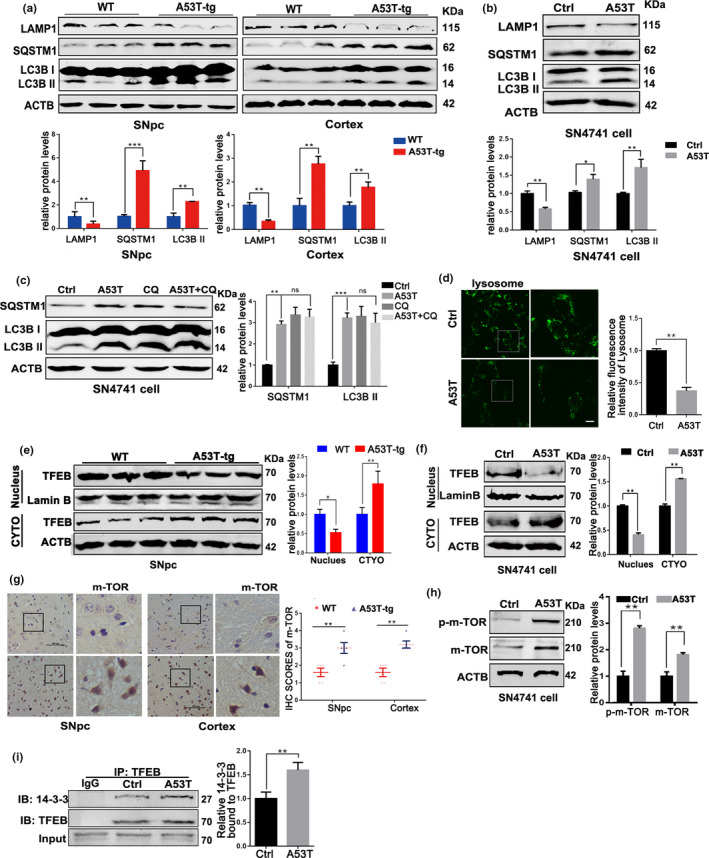
Figure 2.

Mutant α‐synucleinA53T elicits autophagy dysfunction via mTOR‐TFEB pathway. (a) Representative immunoblots and quantification of the levels of LAMP1, SQSTM1, and LC3B II in wild‐type (WT) or α‐synucleinA53T‐tg mice. Mean ± SEM, n = 3. (b) Representative immunoblots and quantification of the levels of LAMP1, SQSTM1, and LC3B II in SN47841 cells transfected with Adenovirus‐Ctrl/A53T. Mean ± SEM, n = 3. (c) Representative immunoblots and quantification of SQSTM1 and LC3B II levels in SN4741 cells pre‐transfected with Adenovirus‐A53T and further treated with CQ (10 μM, 4 hr). Means ± SEM, n = 3. (d) Representative images and quantification of Lysosomes (green) in SN4741 cells. Scale bars, 10 μm. (e,f) Levels of TFEB from nuclear fractions, cytoplasmic fractions and total cell lysates in SNpc of mice (e) and SN4741 cell (f) were measured and analyzed. Means ± SEM, n = 3. (g) Representative mTOR staining of SNpc and Cortex tissue of WT and α‐synucleinA53T‐tg mice. Statistical analysis of the scores of mTOR staining shown in right. Scale bars, 100 μm. (h) Representative immunoblots and quantification of the levels of p‐mTOR and mTOR in SN4741 cells. Mean ± SEM, n = 3. (i) SN4741 cells were transfected with Adenovirus‐Ctrl/A53T. Then, the interaction between 14‐3‐3 and TFEB was measured in TFEB Immunoprecipitates. lgG worked as an immunological control. Means ± SEM, n = 3 (the statistical significantly was analyzed by unpaired Student's t test, *p < .05, **p < .01 and ***p < .001). TFEB, transcription factor EB
