FIGURE 2.

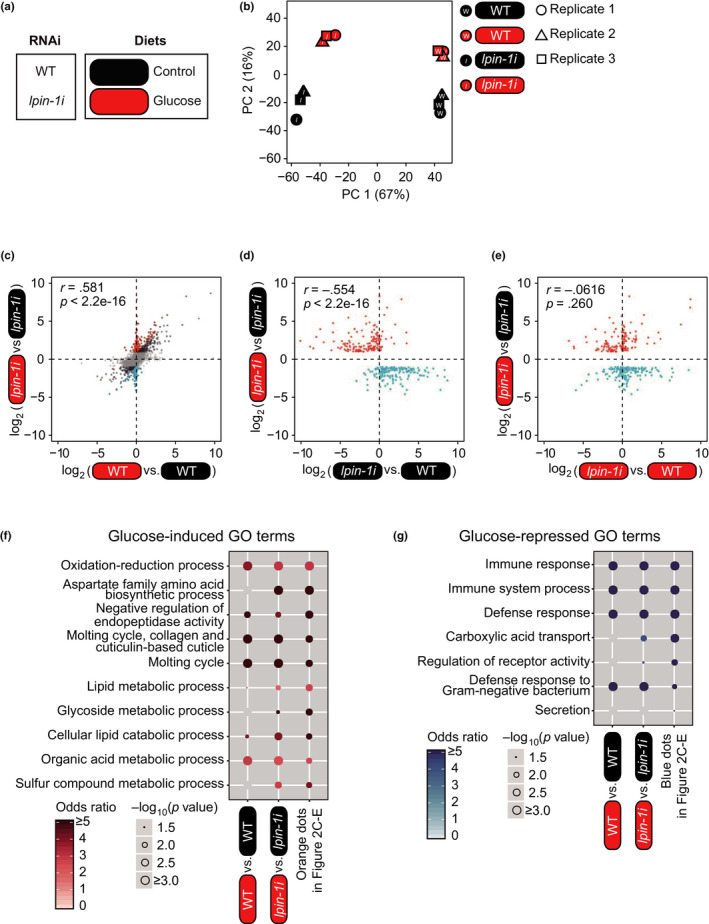
Transcriptomic changes caused by lpin‐1 RNAi on glucose‐rich diets. (a) Labeling for four different experimental conditions used for RNA seq. WT (wild‐type) and lpin‐1i indicate control(RNAi) and lpin‐1(RNAi), respectively. Round squares indicate the types of diets (black: control diets, red: glucose‐rich diets). (b) A principal component (PC) analysis showing separation among the four different conditions used for RNA seq. (c) A scatter plot showing the effects of glucose‐rich diet feeding on lpin‐1(RNAi) animals and WT animals. Black, orange, and blue dots indicate differentially expressed genes upon feeding glucose‐rich diets under lpin‐1 RNAi conditions (fold change > 2, Benjamini and Hochberg (BH)‐adjusted p value < .05). Orange dots and blue dots indicate 161 upregulated genes and 176 downregulated genes that were changed greater (fold change > 2) in lpin‐1 RNAi conditions than in control RNAi conditions, respectively. Pearson correlation coefficient (r) and its significance (p) are marked. We analyzed gene expression changes among specific tissues because of the possibility that mRNA abundance was affected by the smaller body size of lpin‐1(RNAi) than that of WT. However, we found that lpin‐1 RNAi did not alter the impact of glucose‐rich diets on the tissue enrichment of gene expression (See Figure S2). (d, e) Scatter plots showing the effects of RNAi targeting lpin‐1 on control diets (d) and on glucose‐rich diets (e). Pearson correlation coefficient (r) and its significance (p) are marked. (f, g) Overrepresented GO terms of genes induced (f) or repressed (g) by glucose‐rich diet feeding in a lpin‐1‐dependent manner. Odds ratios indicate the enrichment of genes of interest for specific terms relative to all background genes. The size of each circle is gradually increased with ‐log10 (p value), and blank indicates p value that is not significant (p > .05). p values were calculated by using hypergeometric test
