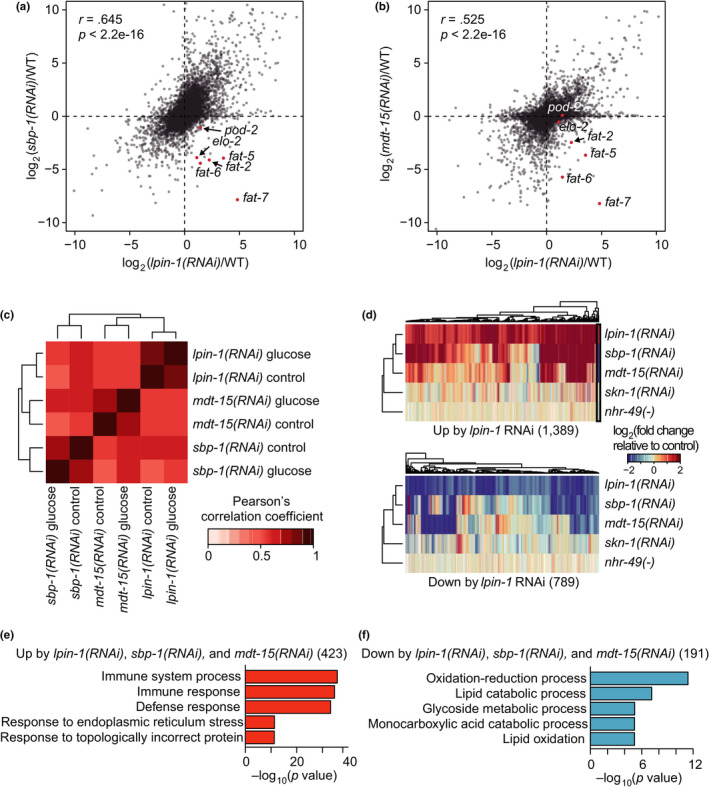
FIGURE 3.

Transcriptomic changes regulated by LPIN‐1 positively correlate with those by SBP‐1 and MDT‐15. (a, b) Scatter plots showing correlation between gene expression changes caused by lpin‐1(RNAi) and those by sbp‐1(RNAi) (a) and by mdt‐15(RNAi) (b). Red dots indicate known SBP‐1/SREBP targets that regulate lipid metabolism. Pearson correlation coefficient (r) and its significance (p) are marked. (c) Positive correlation among gene expression changes caused by RNAi targeting lpin‐1, sbp‐1, and mdt‐15 persisted regardless of treatment with glucose‐rich diets. (d) Heatmaps showing expression changes of genes whose expression was altered by lpin‐1(RNAi) compared with those by sbp‐1(RNAi) (Lee et al., 2015), mdt‐15(RNAi) (Lee et al., 2015), skn‐1(RNAi) (Steinbaugh et al., 2015), and nhr‐49(nr2041) [nhr‐49(‐)] mutation (Pathare et al., 2012). All these genetic perturbation conditions were compared with their relevant controls: lpin‐1(RNAi) versus. WT, sbp‐1(RNAi) versus. WT, mdt‐15(RNAi) versus. WT, skn‐1(RNAi) versus. WT, and nhr‐49(‐) versus. WT. Black box indicates a group of known SBP‐1/SREBP targets that regulate lipid metabolism. (e, f) Overrepresented GO terms of genes commonly up‐ (e) and down‐ (f) regulated by RNAi targeting lpin‐1, sbp‐1, and mdt‐15. p values were calculated by using hypergeometric test
