FIGURE 5.

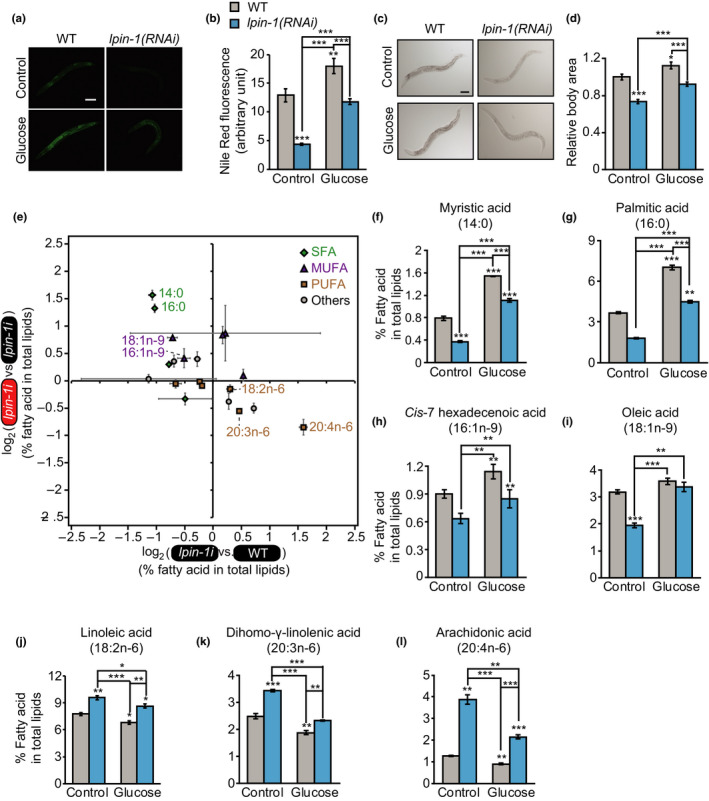
Inhibition of LPIN‐1 and glucose‐rich diet feeding affects the level and the composition of lipids in an opposite direction. (a, b) lpin‐1 RNAi decreased lipid levels on control and glucose‐rich diets. Representative images of Nile red‐stained worms upon treating with control or lpin‐1 RNAi with or without additional 2% glucose (a) and quantification (b) of the data shown in panel a (n ≥ 26 from three independent experimental sets, two‐tailed Student's t test, **p < .01, ***p < .001). Error bars represent standard error of the mean (SEM). Scale bar: 100 μm. (c, d) lpin‐1(RNAi) reduced the body area of worms on control and glucose‐rich diets. The relative ratio of body sizes was calculated by dividing body area of each condition to that of WT worms on control diets. Representative images (c) and the quantification (d) of the data shown in panel c (n ≥ 28 from three independent experimental sets). Error bars represent SEM. Scale bar: 100 μm. (e) The ratio of fatty acid levels in total lipids (%) (n = 3). X‐axis shows the ratio of percent fatty acids in lpin‐1(RNAi) animals to those in WT animals on control diets, indicating the effects of lpin‐1 RNAi on changes in specific fatty acid levels. Y‐axis shows the ratio of percent fatty acids of lpin‐1(RNAi) worms on glucose‐rich diets versus those on control diets, indicating the effects of glucose‐rich diets on changes in specific fatty acid levels in lpin‐1(RNAi) worms. Green diamond, saturated fatty acids (SFAs); purple triangle, monounsaturated fatty acids (MUFAs); ocher square, polyunsaturated fatty acids (PUFAs); gray circles, others (iso‐C15 fatty acid (15:iso), iso‐C17 fatty acid (17:iso), cyclic C17 fatty acid (17:cyc), ricinoleic acid (18:1OH), and cyclic C19 fatty acid (19:cyc)). Error bars represent SEM. (f‐l) Percentage of specific fatty acid in total lipids. The levels of SFAs, myristic acid (14:0) (f) and palmitic acid (16:0) (g), and MUFAs, cis‐7 hexadecenoic acid (16:1n‐9) (h) and oleic acid (18:1n‐9) (i) were decreased by lpin‐1 RNAi but increased by glucose‐rich diet feeding. In contrast, the levels of ω‐6 PUFAs, linoleic acid (18:2n‐6) (j) dihomo‐γ‐linolenic acid (20:3n‐6) (k) and arachidonic acid (20:4n‐6) (l), were increased by lpin‐1 RNAi but decreased by glucose‐rich diet feeding. Two‐tailed Student's t test was used for statistics for this figure (n = 3, * p < .05, ** p < .01, *** p < .001). Error bars represent SEM. See Figure S5D‐P for the levels of the other fatty acids that we measured and Table S5 for statistical analysis
