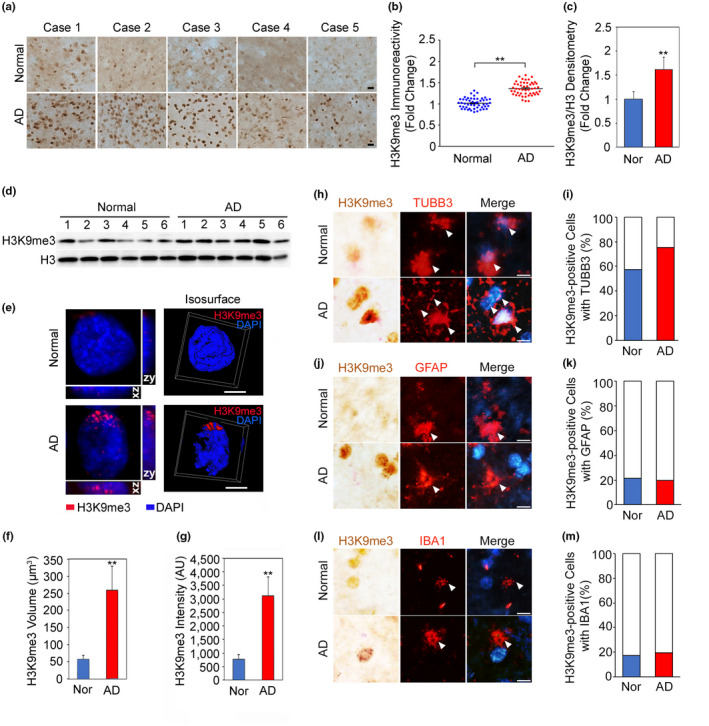
FIGURE 1.

H3K9me3‐dependent heterochromatin is altered in the cortical neurons of AD. (a) H3K9me3 immunoreactivity was increased in the cortical neurons of AD compared to normal subjects. Scale bars (black): 20 µm. (b) The densitometry analysis showed a significant increase of H3K9me3 immunoreactivity in the cortical neurons of AD [cases, N = 5; cell counting, n = 50 (10 cells/case)] compared to normal subjects [cases, N = 5; cell counting, n = 50 (10 cells/case)]. H3K9me3 levels were normalized to histone H3. **Significantly different at p < .001. (c) The densitometry analysis of Western blot analysis showed a significant increase of H3K9me3 levels in AD (N = 9) compared to normal subjects (N = 9). H3K9me3 levels were normalized to histone H3. **, Significantly different at p < .001. (D) A representative Western blot showing elevated H3K9me3 levels in the temporal cortex of AD patients (N = 6) compared to normal subjects (N = 6). (e) Three‐dimensional (3D) reconstruction of confocal fluorescent micrographs and isosurface images illustrate that spatially condensed patterns of H3K9me3‐positive heterochromatin structures (red) are increased eccentrically in AD. The nuclei were counter stained with DAPI (blue). Scale bars (white): 8 µm. (f, g) Both the volumetric expansion and the intensity of H3K9me3‐dependent heterochromatin are significantly increased in AD. **Significantly different at p < .001. (h) H3K9me3 immunoreactivity was colocalized with the neuron marker (TUBB3) in the cortex of AD brain and normal subjects. (i) The counting analysis showed a significant increase of H3K9me3 immunoreactivity in the TUBB3‐positive cortical neurons of AD. (j) H3K9me3 immunoreactivity was not highly colocalized with the astrocyte marker (GFAP) in the AD and normal subjects. (k) The counting analysis showed no significant changes of H3K9me3 immunoreactivity in the GFAP‐positive astrocytes in the cortex of AD. (l) H3K9me3 immunoreactivity was not highly colocalized with the microglial marker (IBA1) in the AD brain and normal subjects. Scale bars (white): 20 µm. (m) The counting analysis showed no significant changes of H3K9me3 immunoreactivity in IBA1‐positive microglia in the cortex of AD
