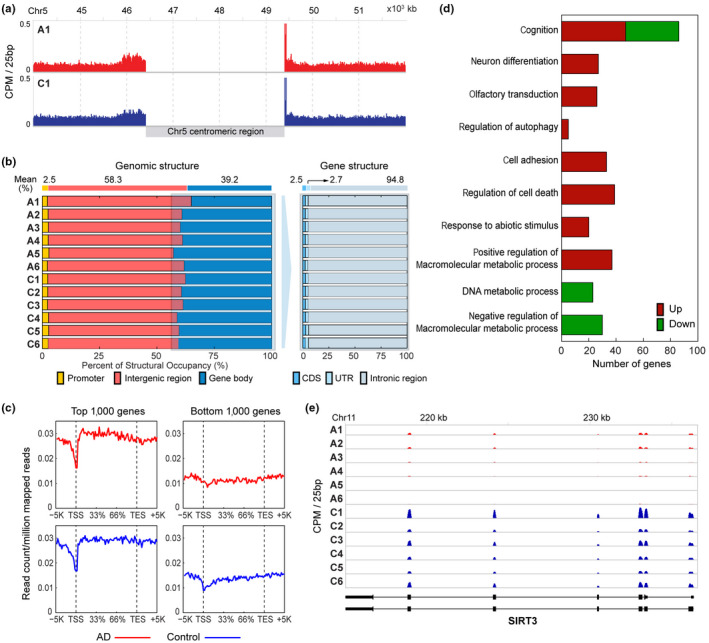
FIGURE 2.

H3K9me3 is differentially marked in AD. (a) Higher occupancy of H3K9me3 in the centromeres of AD (A1) and normal control (C1) brains. See also Figure S1 for the other samples. (b) Genomic structural occupancy of H3K9me3. Right panel shows the proportions of H3K9me3 occupancy in the promoter, intergenic, and gene body regions in six AD (A1‐6) and normal control (C1‐6) brains. Left panel shows the proportions of H3K9me3 gene body occupancy in CDS, UTR, and introns. (c) H3K9me3 occupancy profiles in the structure of genes with high (left) and low (right) levels of H3K9me3 in AD (top) and normal control (bottom) brains. For each gene, the gene structure spanned from 5kb upstream of TSS to 5kb downstream of TES, and the whole region was divided into 100 bins. The mean read counts of the top or bottom 1000 genes with high or low levels of H3K9me3, respectively, were displayed in individual bins. (d) GOBPs (by the DMGs) that were significantly associated with in AD (p < .01). The number of genes with increased (red) or decreased (green) levels of H3K9me3 in AD involved in each GOBP is shown. (e) A representative gene with decreased levels of H3K9me3 in AD (A1‐6) compared to normal control subjects (C1‐6). Read counts were displayed along exons and introns shown in the bottom
