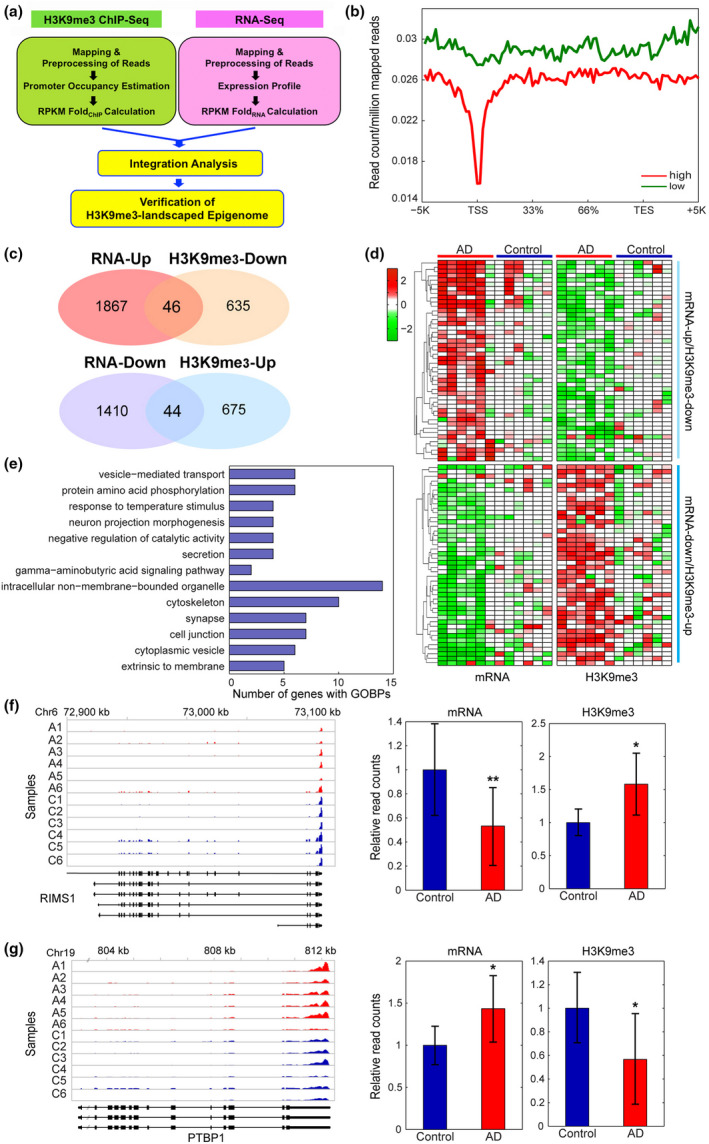
FIGURE 4.

Integrated analysis of genome‐wide ChIP‐ and mRNA‐sequencing identifies alterations of H3K9me3‐enriched transcriptomes in AD. (a) A scheme representing the integration analysis strategy to identify H3K9me3‐landscaped transcriptome signatures in AD patients. (b) mRNA expression stratified profiles of H3K9me3 occupancy in the gene structure. The profiles were calculated as described in Materials and Methods and represented for highly (red) and lowly (green) expressed genes, respectively. (c) The overlapped regions of Venn diagrams showed altered epigenomes whose levels of H3K9me3 and mRNA are inversely correlated (H3K9me3‐Up versus RNA‐Down and vice versa) in AD patients. (d) Heat maps showing the genes with divergent changes of H3K9me3 and mRNA expression levels between AD patients (N = 6) and normal subjects (N = 6). The dendrogram was generated by hierarchical clustering of H3K9me3 and mRNA expression changes using Ward's linkage and Euclidean distance as a dissimilarity measure. (e) GOBPs analysis representing the epigenomes whose levels of H3K9me3 and mRNA were significantly and inversely correlated (H3K9me3‐Up versus RNA‐Down and vice versa) in AD patients. The number of up‐ (red) or down‐regulated (green) genes involved in each GOBP is shown. (f) A representative down‐regulated (RIMS1) gene with increased H3K9me3 levels in AD patients (A1‐6) compared to normal control subjects (C1‐6). (g) A representative up‐regulated (PTBP1) gene with decreased H3K9me3 levels in AD patients (A1‐6) compared to normal control subjects (C1‐6). For each gene, read counts were displayed along exons and introns shown in the bottom. Relative normalized read counts were shown in the barplots. Significantly different at *p < .05; **p < .01
