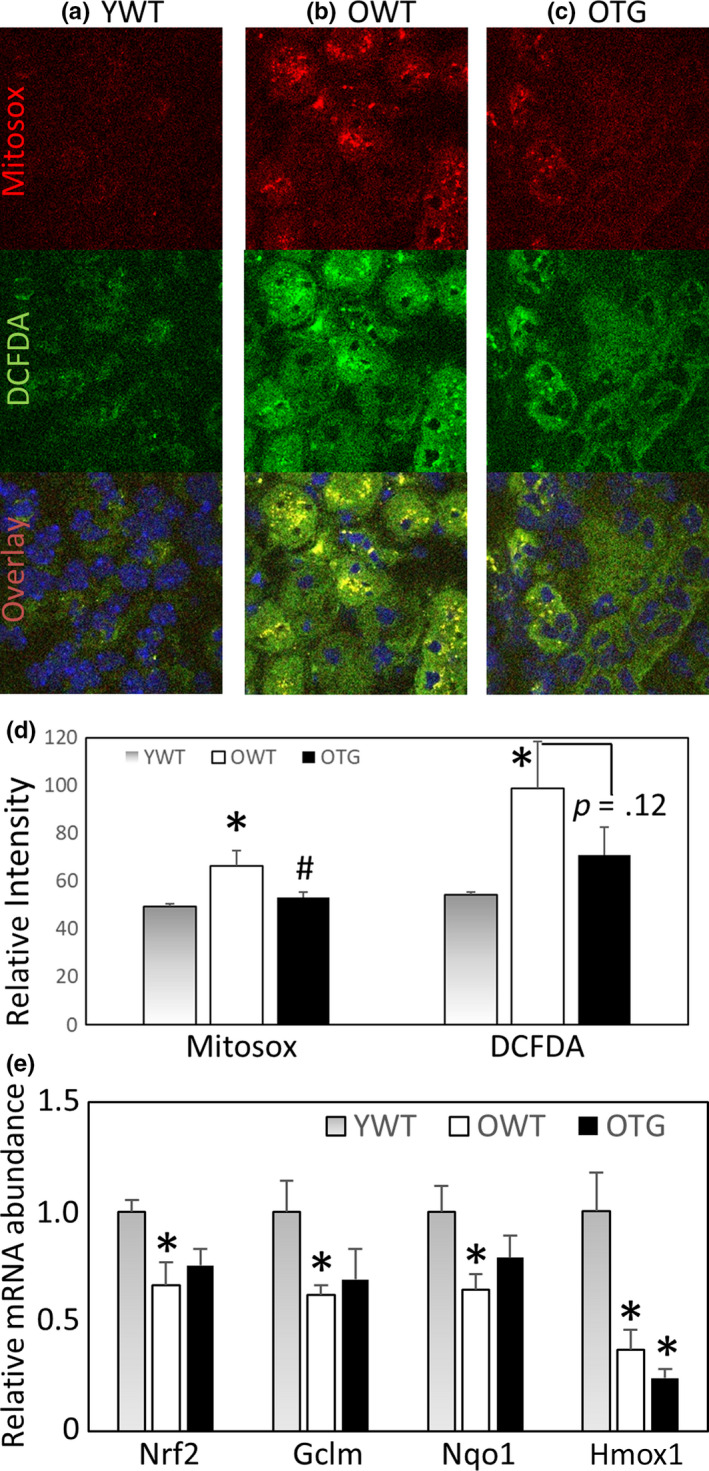
FIGURE 5.

(a–c) Representative images of ex vivo staining with MitoSOX (top row), an indicator of mitochondrial superoxide, DCFDA (middle row), an indicator of total cellular ROS, and the overlay images (bottom row) with Hoechst 33342 nuclear stain. (D) Quantification of relative fluorescence intensity for MitoSOX and DCFDA. N = 3. *p < .05 versus YWT, #p < .05 versus OWT. (e) Relative mRNA abundance of Nrf2 and its targets Gclm, Nqo1 and Hmox1 in kidney. N = 3–5. *p < .05 versus YWT
