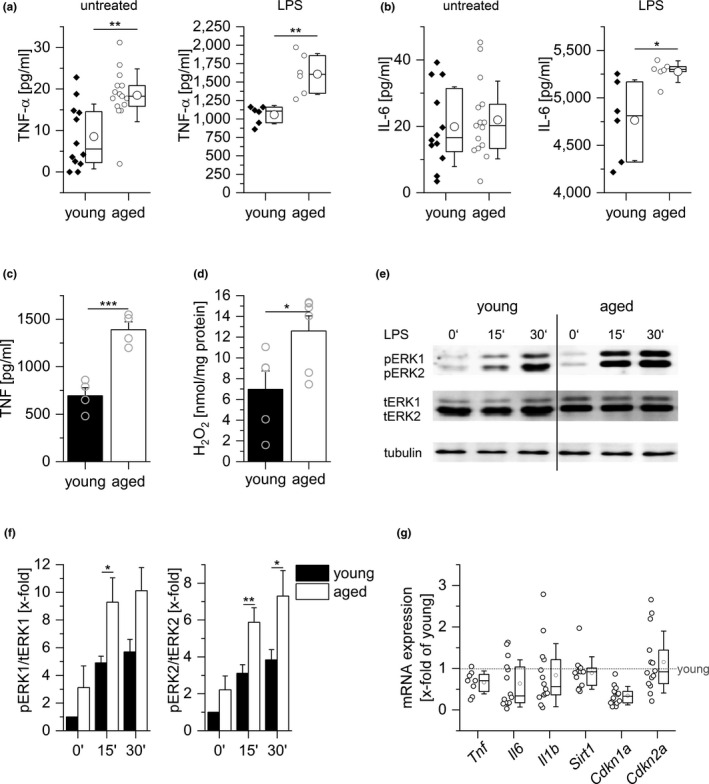
FIGURE 1.

Inflammation in aged mice. Levels of TNF‐α (a) and IL‐6 (b) in sera from young (10 weeks) and aged (20–22 months) C57BL/6 mice as determined by ELISA; untreated: n = 12 (young) or n = 15 (aged), LPS (5 mg/kg BW, 4 hr): n = 6. (c) PMs obtained from young and aged mice were stimulated with LPS (100 ng/ml, 4 hr), and TNF was quantified in the supernatants by bioassay (n = 4, triplicates). (d) H2O2 production was measured in PM supernatants by homovanillic acid assay (young: n = 5, aged: n = 6). (e, f) ERK phosphorylation after LPS treatment (100 ng/ml) was examined by Western blot. Total ERK (tERK) and tubulin served as loading controls. (e) One representative blot out of six is shown. (f) pERK1/2 signal intensities were normalized to total ERK1/2. Values for untreated cells from young mice were set as 1 (n = 6 in replicates). (g) Gene expression in PMs from young and aged mice was determined by qPCR and normalized against the housekeeping gene (Ppia). Values for PMs from young mice were set as 1 (n = 14). Box plots show the 25–75th percentiles (box), mean (square), median (line), and SD (whiskers). Bars show the mean ± SEM, and circles within bars indicate the mean of each individual experiment. *p < .05, **p < .01, ***p < .001 by two‐tailed t test (a–c), Mann–Whitney U test (d, g), or ANOVA with Bonferroni's post hoc test (f)
