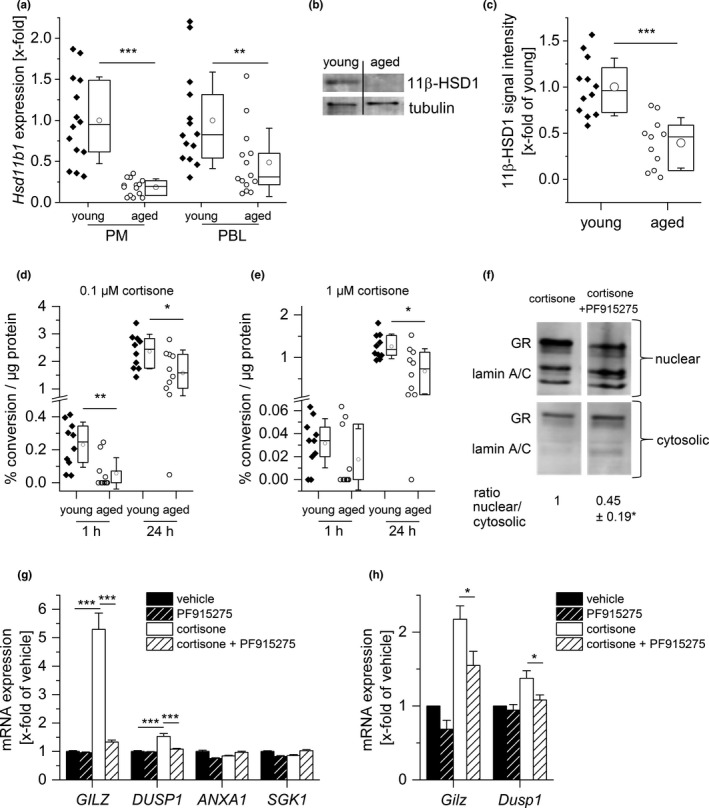
FIGURE 3.

Alterations in GC metabolism in aged immune cells. (a) Hsd11b1 expression in PMs and PBLs from young and aged mice (n = 14) was measured by RT‐qPCR, normalized to Ppia, and expressed as x‐fold of young. (b, c) 11β‐HSD1 protein expression was measured in PMs (young: n = 12, aged: n = 11). (b) Representative blot. (c) Densitometric analysis, normalized to the housekeeping protein tubulin. Values for young mice were set as 1. (d, e) PMs isolated from young and aged animals (n = 10) were incubated for 1 or 24 hr with 0.1 µM (d) or 1 µM (e) cortisone‐D8, and the conversion to cortisol‐D8 was measured in supernatants by LC‐HRMS/MS. Conversion percentages were normalized to total protein content. (f, g) THP‐1 macrophages were treated with either vehicle (0.1% DMSO) or the 11β‐HSD1 inhibitor PF915275 (100 nM) for 1 hr, followed by cortisone treatment (100 nM) for 4 hr. (f) GR content in nuclear and cytosolic fractions was analyzed by Western blot. Lamin (A/C) was used as an indicator for the presence or absence of nuclear proteins. One representative blot is shown. Densitometric quantification data are presented as x‐fold of the nuclear/cytosolic GR ratio in cortisone‐treated cells (n = 4, *p < .05 versus cortisone‐treated cells). (g) GR‐dependent gene expression was analyzed by qPCR and normalized to the housekeeping gene ACTB. Data are presented as x‐fold of vehicle‐treated cells (n = 3, triplicates). (h) PMs obtained from young mice were treated with either vehicle (0.1% DMSO) or PF915275 (100 nM) for 1 hr, followed by cortisone treatment (100 nM) for 4 hr. Gilz and Dusp1 expression were analyzed by qPCR, normalized to the housekeeping gene Ppia, and expressed as x‐fold of vehicle control (n = 8). Box plots show the 25–75th percentiles (box), mean (circle), median (line), and SD (whiskers). Bars show the mean ± SEM. *p < .05, **p < .01, ***p < .001 by two‐tailed t test (a, c), one‐sample t test (f), Mann–Whitney U test (d, e), or ANOVA with Bonferroni's post hoc test (g, h)
