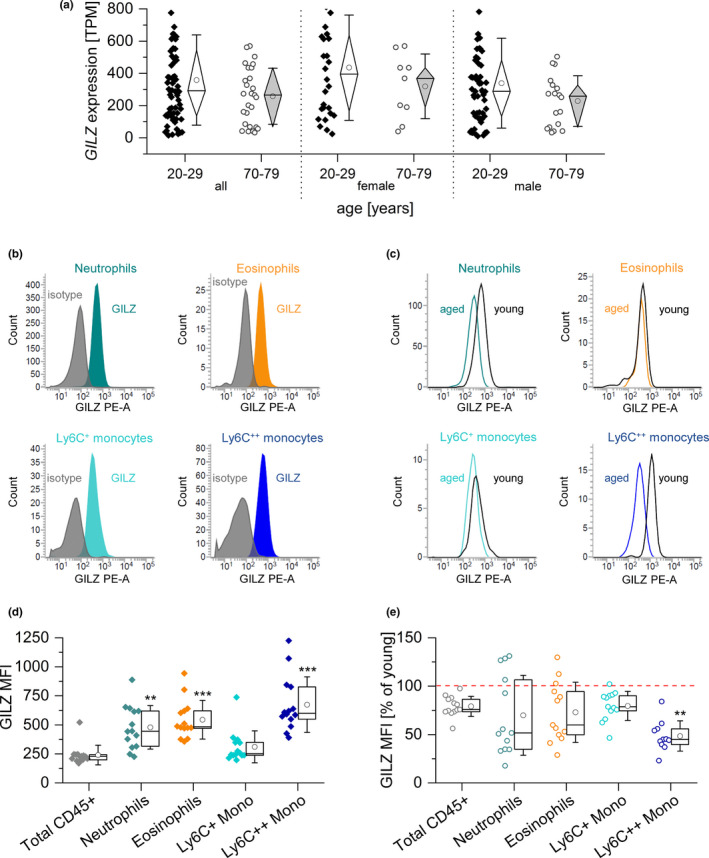
FIGURE 4.

GILZ expression in human and murine blood samples from young and aged individuals. (a) GILZ expression in human blood samples. Expression data were retrieved from the GTEx database and are shown as TPM (transcripts per million) (20–29 years: 27 ♀, 57 ♂; 70–79 years: 9 ♀, 18 ♂). (b) Representative histograms showing GILZ expression in myeloid subsets in young mice. Colored: GILZ signal; gray: isotype control. (c) Representative histograms showing GILZ signals in cells from aged and young mice. Gray line: young; colored line: aged. (d) Background‐subtracted GILZ median fluorescence intensity (MFI) in myeloid blood cells from young mice (n = 14). **p < .01, ***p < .001 compared with MFI values for total CD45+ cells by ANOVA with Bonferroni's post hoc test. (e) GILZ expression in myeloid subsets of aged mice (n = 13). The GILZ MFI of young cells was set as 100% for each subset.Box plots show the 25‐75th percentile (box), mean (circle), median (line), and SD (whiskers). *p < .05, **p < .01 compared with the same subset in young animals by Mann–Whitney U test. Mono: monocytes
