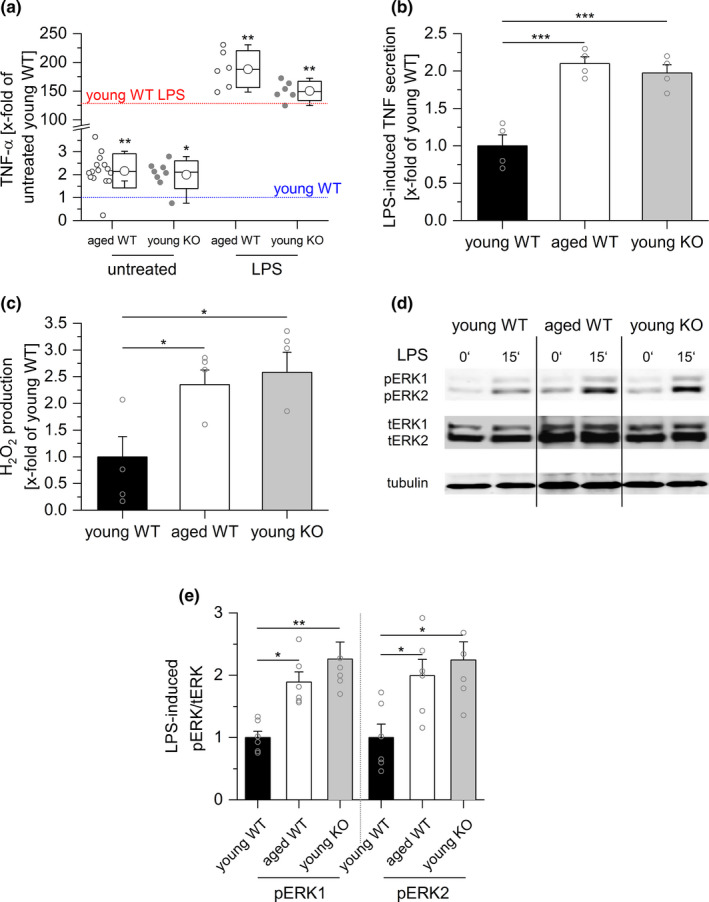
FIGURE 6.

GILZ knockout mimics inflammaging. (a) Serum TNF‐α levels in young GILZ knockout (KO) mice were determined by ELISA and compared with serum concentrations in young and aged wild‐type (WT) mice (see Figure 1). The mean of the values for young untreated WT mice was set as 1 (blue line). The red line indicates the mean TNF‐α level in LPS‐treated young WT mice, expressed as x‐fold of untreated young WT mice. Untreated young KO: n = 12, LPS‐treated young KO (5 mg/kg BW, 4 hr): n = 6. *p < .05, **p < .01 compared with equally treated young WT animals by ANOVA with Bonferroni's post hoc test. (b) PMs obtained from young and aged WT, as well as young KO mice, were stimulated with LPS (100 ng/ml, 4 hr), and TNF production was assessed by bioassay. Values for young WT mice were set as 1 (n = 4, triplicates). (c) H2O2 production was measured in PM supernatants by homovanillic acid assay (young WT and KO: n = 5, aged: n = 6). (d, e) ERK phosphorylation after LPS treatment (100 ng/ml, 15') was analyzed by Western blot. (d) One representative blot out of six is shown. Total ERK (tERK) and tubulin served as loading controls. (e) Densitometric analysis of LPS‐induced ERK phosphorylation. pERK1/2 signal intensities were normalized to tERK1/2 and expressed as x‐fold of young WT. Box plots show the 25–75th percentiles (box), mean (circle), median (line), and SD (whiskers). Bars show the mean ± SEM, and circles within bars indicate the mean of each experiment. *p < .05, **p < .01, ***p < .001 by ANOVA with Bonferroni's post hoc test
