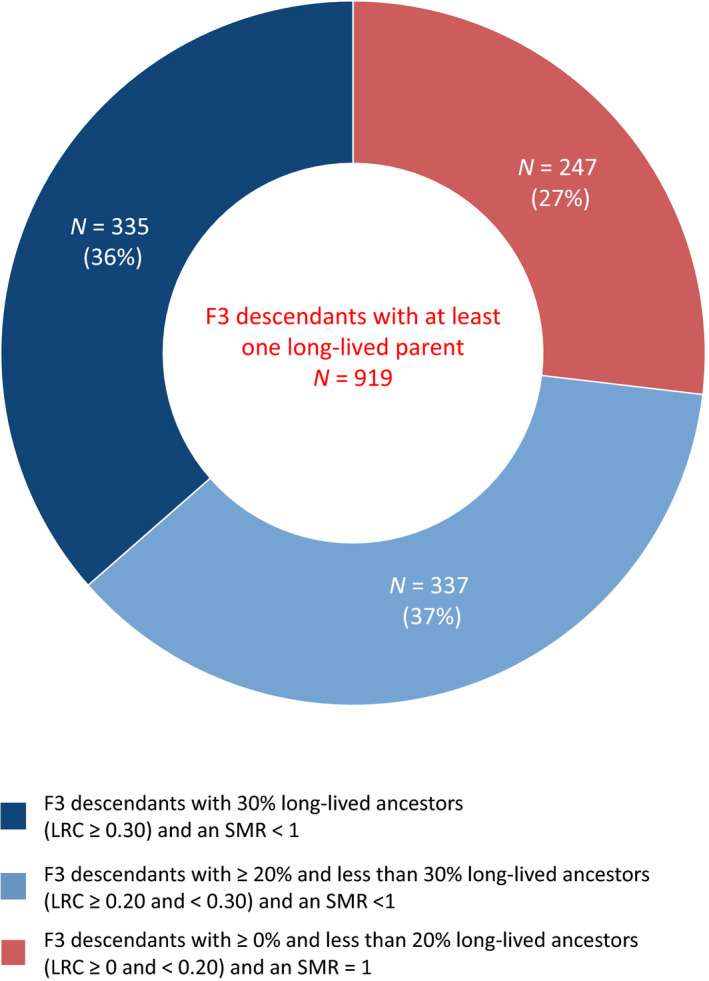
Figure 4.

LRC score for F3 descendants with at least one long‐lived parent. This center of this doughnut figure shows all F3 descendants (N = 919) with at least one long‐lived (top 10%) parent, ignoring the rest of the ancestors. Thus, at least means that they could have more than 1 long‐lived ancestor but we actively selected for the presence of only 1 such ancestor. The edges of the doughnut illustrate the number and proportion of these 919 F3 descendants with at least one long‐lived parent who had (1) 30% or more long‐lived ancestors (LRC ≥ 0.30) and excess survival compared with the general population (SMR < 1), N = 335 (36%), (2) between 20% and 30% long‐lived ancestors (LRC ≥ 0.20 and <0.30) and excess survival compared with the general population (SMR < 1), N = 337 (37%), and (3) between 0% and 20% long‐lived ancestors (LRC > 0.20 and <0.20) and a similar survival pattern to the general population (SMR ~ 1), N = 247(27%)
