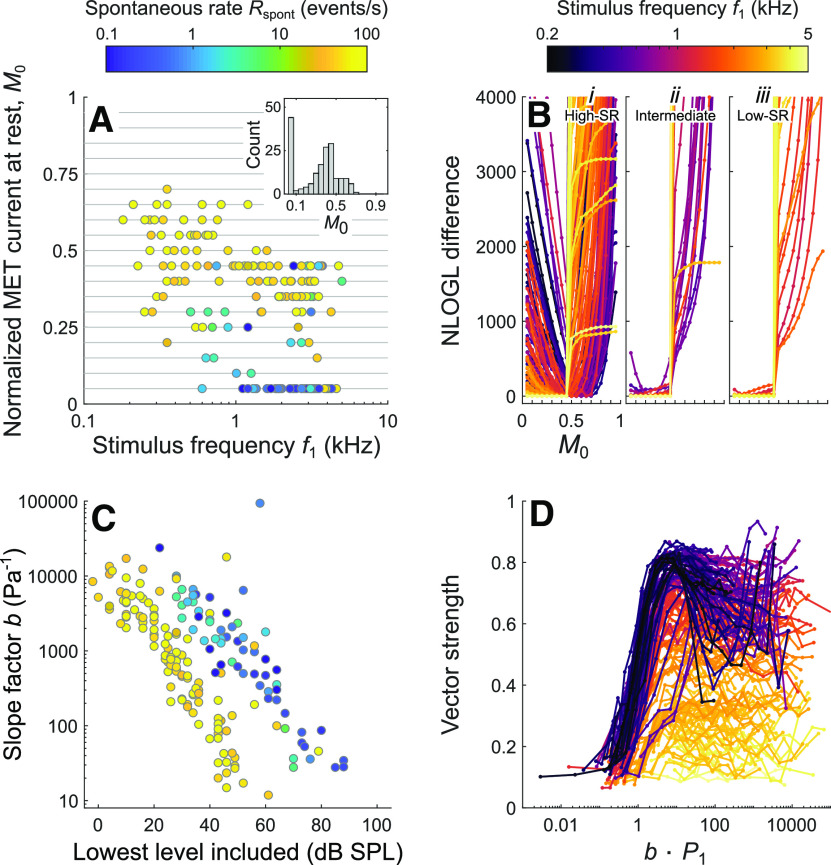
Figure 6.
Parameter estimates for the Boltzmann transducer function from the current model. A, Estimates of the normalized MET current at rest, M0, plotted as a function of stimulus frequency and colored by spontaneous event rate. Inset, Distribution of M0 estimates. B, Difference between the negative log likelihood (NLOGL) for a given M0 and the negative log likelihood for the best M0, plotted as a function of M0. Lines connect results for a given ANF and stimulus frequency and are colored by stimulus frequency. The three subpanels show results grouped by SR: Bi–Biii, >10 spikes/s, 1-10 spikes/s, and <1 spike/s, respectively. C, Estimates of the slope factor b of the Boltzmann transducer function, plotted as a function of the lowest stimulus level included in each fit and colored by spontaneous event rate. Stimulus levels were included only if they yielded ≥125 spikes and significant vector strength. D, Vector strength, obtained from each period histogram in the data, plotted as a function of the product of b and the stimulus amplitude P1. Lines connect results for a given ANF and stimulus frequency and are colored by stimulus frequency.

