Figure 2.
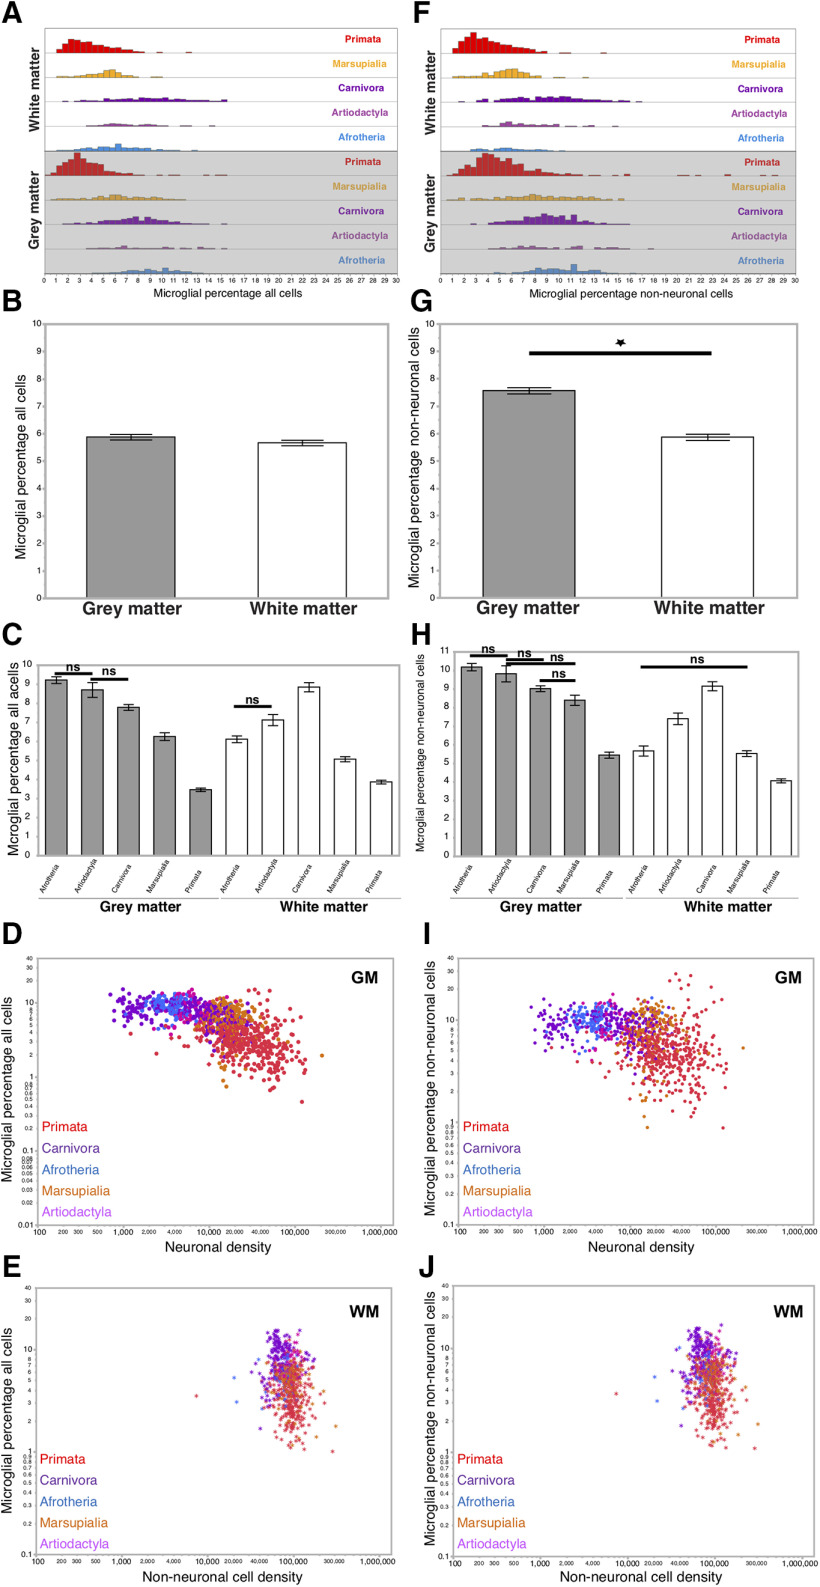
Average percentages of PI microglial cells represent 6% of all cortical cells in gray and white matter and correlate only slightly with neuronal and non-neuronal cell densities. A, Distribution of the percentage of all cortical cells that are microglial cells in the gray and white matter per clade. The ranges of distribution and means of the percentage of all cortical cells that are microglia are similar across clades within the cortical gray matter (values in Table 2). B, Average percentages of total cells that are microglia across clades and species represent a constant ∼6% in both cortical gray and white matter. Wilcoxon p = 0.2650 between gray and white matter in all mammalian species. C, Average percentages of total cells that are microglia in gray and white matter across clades and species. In the gray matter, significant differences are found across all pairs of clades (Wilcoxon, p < 0.0001), except between Artiodactyla and both Afrotheria (Wilcoxon, p = 0.1000; nonsignificant) and Carnivora (Wilcoxon, p = 0.0963). In the white matter, significant differences are found across all pairs of clades (p < 0.01 for all pairs), except between Artiodactyla and Afrotheria (p = 0.0121). For each clade individually, we find significant differences in the percentage of all cells that are microglial between white and gray matter samples (Wilcoxon p < 0.0001 for Afrotheria and Marsupialia; p = 0.0037 for Artiodactyla; p = 0.0004 for Carnivora and Primata). D, Percentages of microglial cells among all cells in the gray matter fail to correlate systematically with the neuronal cell density in the sample. Spearman ρ and p values for each clade are given in Table 2. E, Percentages of microglial cells among all cells in the white matter fail to correlate systematically with the non-neuronal cell density in the sample. Spearman ρ and p values for each clade are given in Table 2. F, Distribution of the percentage of cortical non-neuronal cells that are microglial cells in the gray and white matter per clade. Ranges and means are listed in Table 3. G, Microglia are a larger average percentage of all non-neuronal cells in cortical gray matter (7.56 ± 0.11%) than in the white matter (5.86 ± 0.13%, Wilcoxon p < 0.0001). H, Average percentages of non-neuronal cells that are microglia in gray and white matter across clades and species. In the gray matter, significant differences are found across all pairs of clades (Wilcoxon, p < 0.01 for all clades), except between Artiodactyla and Afrotheria, Marsupialia, and Carnivora (p = 0.2645, p = 0.0240, and 0.2106, respectively) and between Marsupialia and Carnivora (p = 0.0837). In the white matter, significant differences are found across all pairs of clades (Wilcoxon, p = 0.0002 between Artiodactyla and Afrotheria; and p < 0.0001 for all other pairs), except between Afrotheria and Marsupialia (p = 0.8582). I, Percentages of microglial cells among non-neuronal cells in the gray matter do not correlate systematically with the non-neuronal cell density in the sample. Spearman correlation ρ and p values are given in Table 3. J, Percentages of microglial cells among non-neuronal cells in the white matter do not correlate systematically with the neuronal cell density in the sample. Spearman correlation ρ and p values are given in Table 3. D, E, I, J, Each data point represents the values found per cortical site examined for each species colored by clade as in the key. Filled circles represent cortical gray matter sites of the Cx, including the hippocampus. *White matter sites. G, *Significance.

