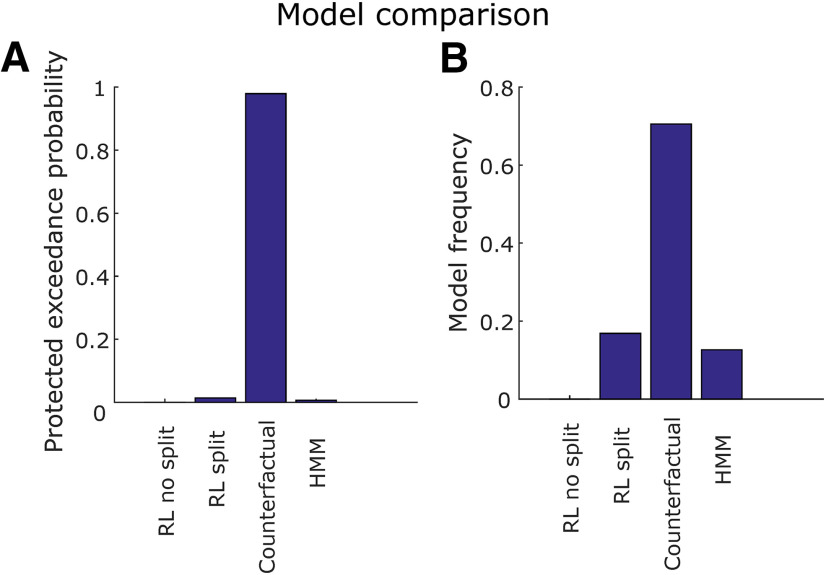
Figure 3.
Model comparison. A, Protected exceedance probability. This is the probability that each one of the four models fit using HBI (RL split, RL no split, counterfactual, and HMM) was more likely than any other, taking into account the possibility that there is no difference between models. B, Model frequency. This is the proportion of individual patients whose behavior is better explained by each model. The counterfactual learning model outperforms the others both in terms of protected exceedance probability and model frequency.

