Figure 5.
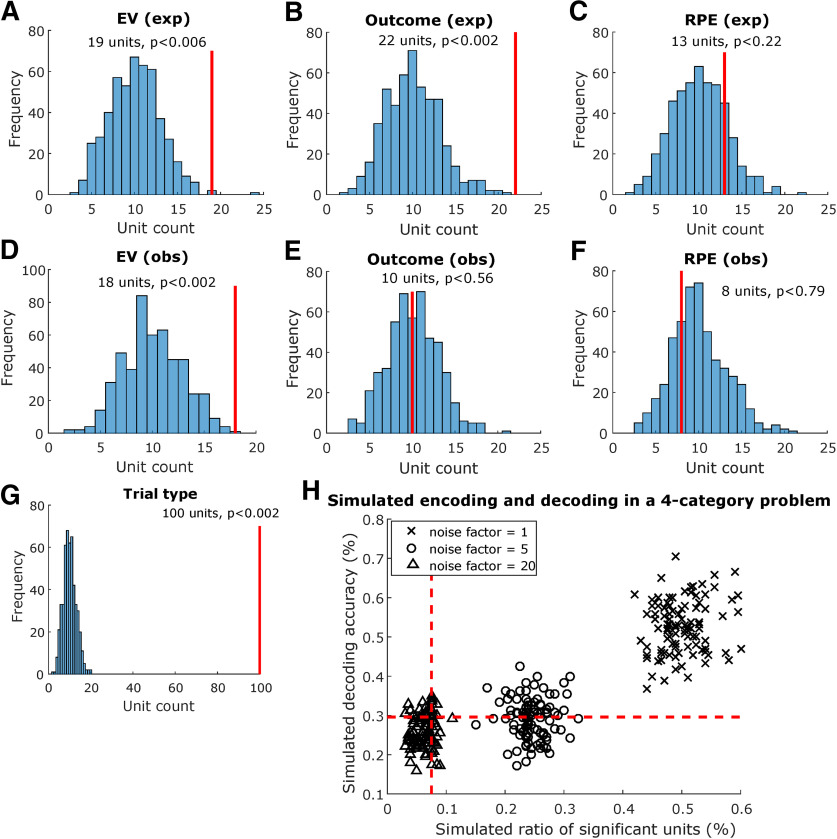
Amygdala single-neuron encoding analysis. A, Preoutcome encoding of EV in experiential trials. Solid red lines indicate how many units were found to be sensitive to the tested variable within the preoutcome period. Histograms indicate how many units were sensitive to the tested variable in each iteration of the permutation test, shuffling variable labels; p values were obtained by computing the proportion of permutation iterations in which unit counts exceeded the true unit count. Similarly, we tested encoding for (B) experiential outcome in the postoutcome period, (C) experiential RPE in the postoutcome period, (D) observational EV in the preoutcome period, (E) observational outcome in the postoutcome period, (F) observational RPE in the postoutcome period, and (G) trial type in whole trials. H, Comparing encoding and decoding in a simulated four-category problem with varying noise levels. We simulated 96 trials with 200 artificial Poisson type neurons whose latent firing rate varied linearly as a function of an artificial categorical variable, chosen randomly between 1 and 4 for each trial. Noise was added to the latent firing rate of each neuron scaled by a noise factor of 1 (crosses), 5 (circles), or 20 (triangles), and simulations were repeated 100 times for each noise level. Each data point in the plot represents one individual simulation. Dashed red lines indicate theoretical chance levels for encoding (vertical) and decoding (horizontal).

