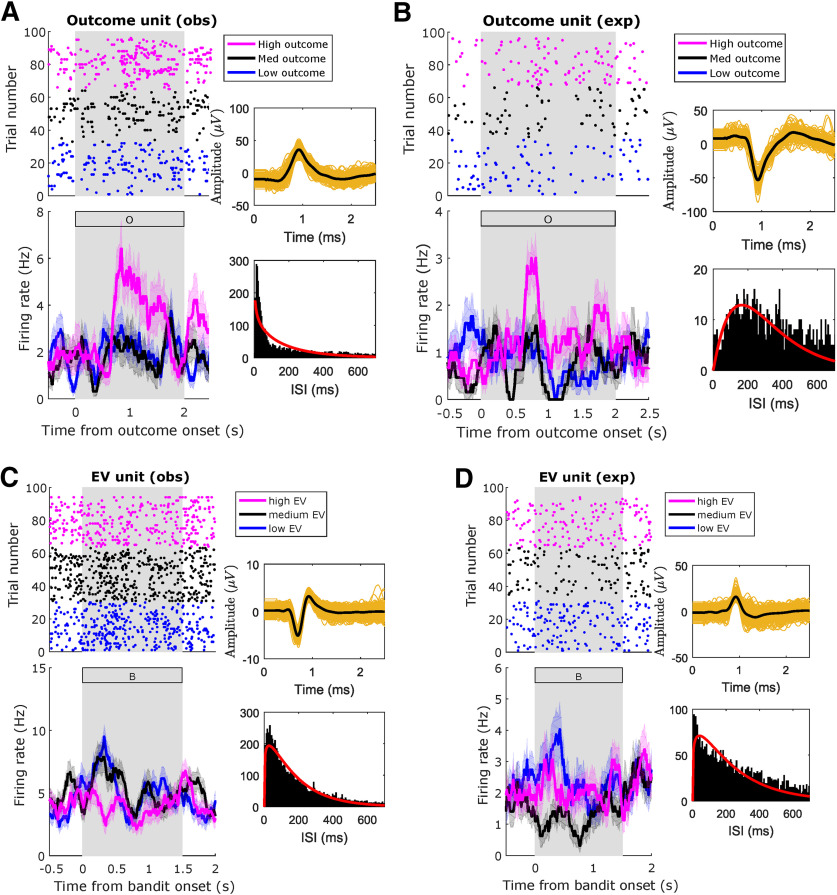
Figure 6.
Amygdala neuron raster plot examples. Example amygdala units, significantly modulated by the indicated regressors, in the indicated conditions. A, Unit modulated by outcome in observational trials during postoutcome period. B, Unit modulated by outcome in experiential trials during postoutcome period. C, Unit modulated by EV in observational trials during preoutcome period. D, Unit modulated by EV in experiential trials during preoutcome period. Top, Raster plots. For plotting purposes only, we reordered trials by regressor levels by obtaining three quantiles from the variable of interest (magenta: high; black: medium; blue: low). Bottom, PSTH (bin size = 0.2 s, step size = 0.0625 s). The annex panels to the right of each raster display spike waveforms (top) and ISI histograms (bottom) from the plotted neuron. Background gray rectangles postoutcome periods (A, B) or preoutcome periods (C, D). Rectangles filled with a letter indicate which stimulus was present on the screen at that time (B: bandit; O: outcome).

