Figure 7.
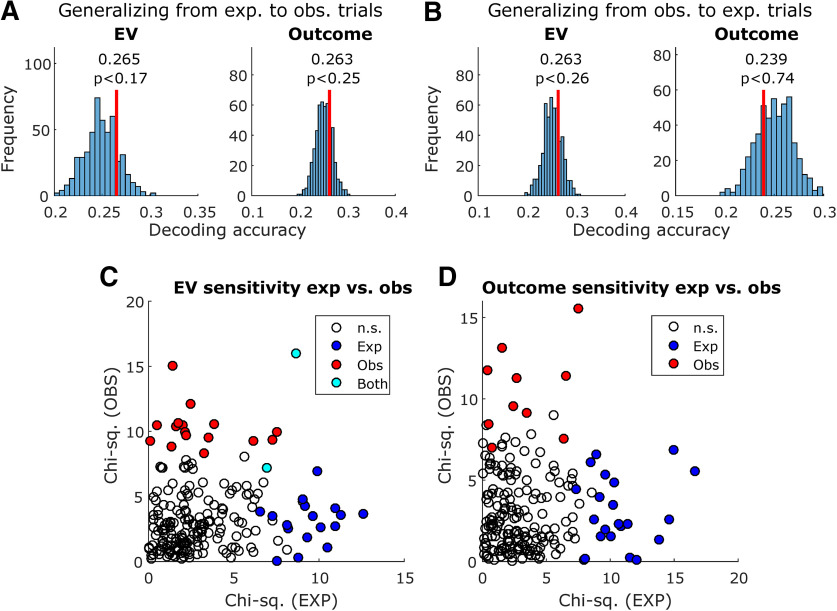
Comparing decoding and encoding across experiential and observational trials. A, Decoding generalization, training a decoder in experiential trials and testing in observational trials. Decoded variables were EV (left) and outcome (right). Vertical red lines indicate decoding accuracy, and histograms indicate decoding accuracy in each instance of the permutation test with shuffled variable labels; p values were obtained by computing the proportion of permutation iterations in which the decoding accuracy exceeded the true decoding accuracy. B, Same, but training in observational trials and testing in experiential trials. C, Sensitivity to EV in each unit, as obtained in the encoding analysis, plotted for experiential trials (x-axis) and observational trials (y-axis). Sensitivity was defined as the χ2 value obtained from the Kruskal–Wallis test used in the encoding analysis. Unfilled data points indicate not sensitive units, blue data points indicate units only sensitive to experiential EV, red data points indicate units only sensitive to observational EV, and cyan data points indicate units sensitive to both experiential and observational EV. D, Same, but for outcome sensitivity.

