Figure 9.
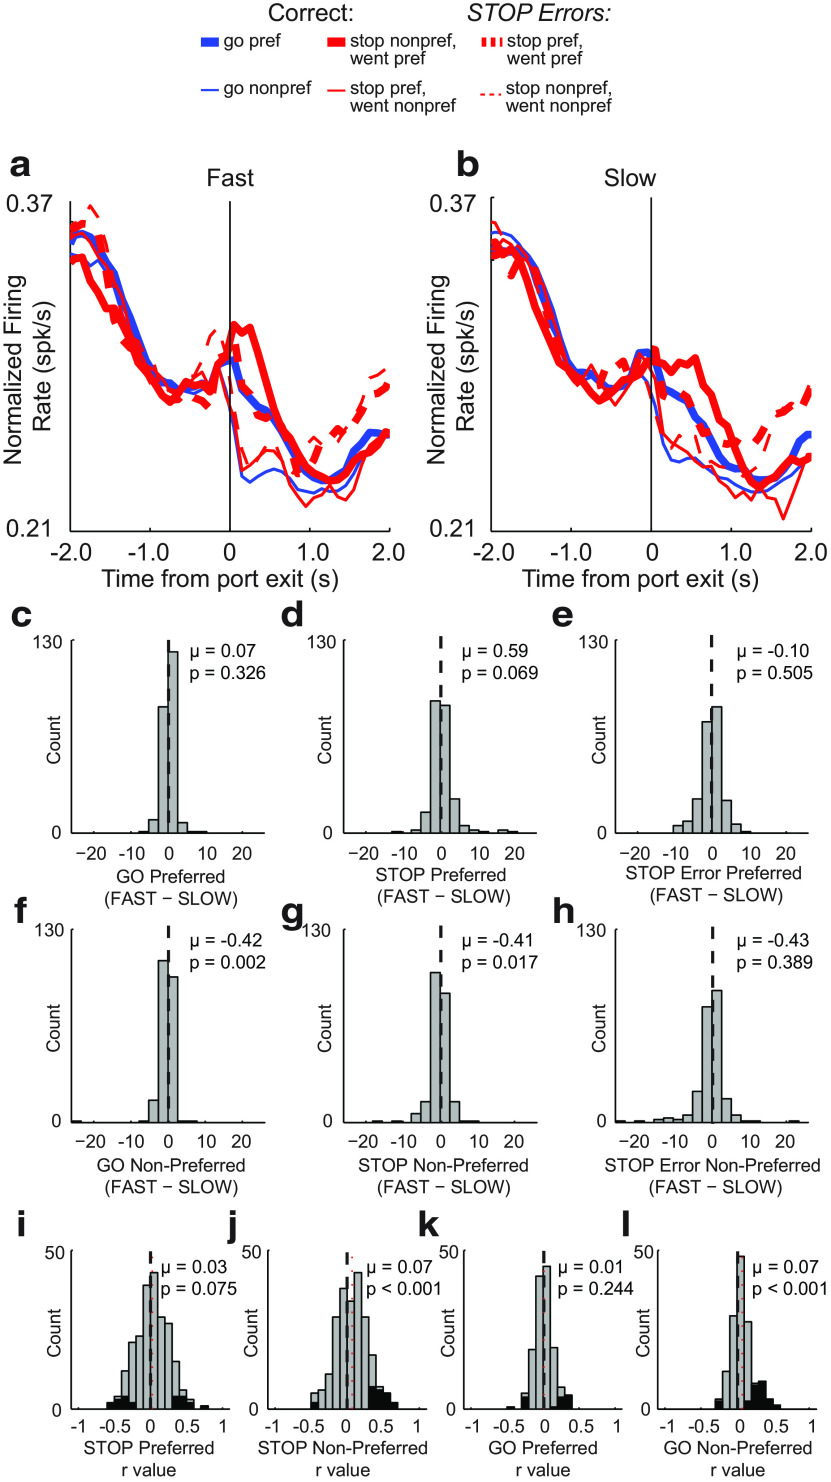
Effects of movement time on RN firing on decreasing cells. a, b, Average population histogram for Fast (a) and Slow (b) trials. Fast and Slow were determined by taking the median split within each recording session. Trial types are distinguished by color: GO, blue; STOP, red; STOP-error, dashed red. Direction is indicated by line thickness: preferred, thick; nonpreferred, thin. c–h, Distribution of speed indices comparing firing during Fast to Slow trials (Fast − Slow) for GO preferred (c) and nonpreferred (f); STOP preferred (d) and nonpreferred (g); and STOP error preferred (e) and nonpreferred (h; Wilcoxon test, μ = mean). i–l, Distribution of r values depicting the correlation between firing rate during the response epoch and movement time for STOP preferred (i) and nonpreferred (j) and GO preferred (k) and nonpreferred (l) directions (Wilcoxon test, μ = mean). Black bars indicated individual neurons that exhibited a significant within-session correlations between firing rate and movement time (p < 0.05).

