
Figure 1.
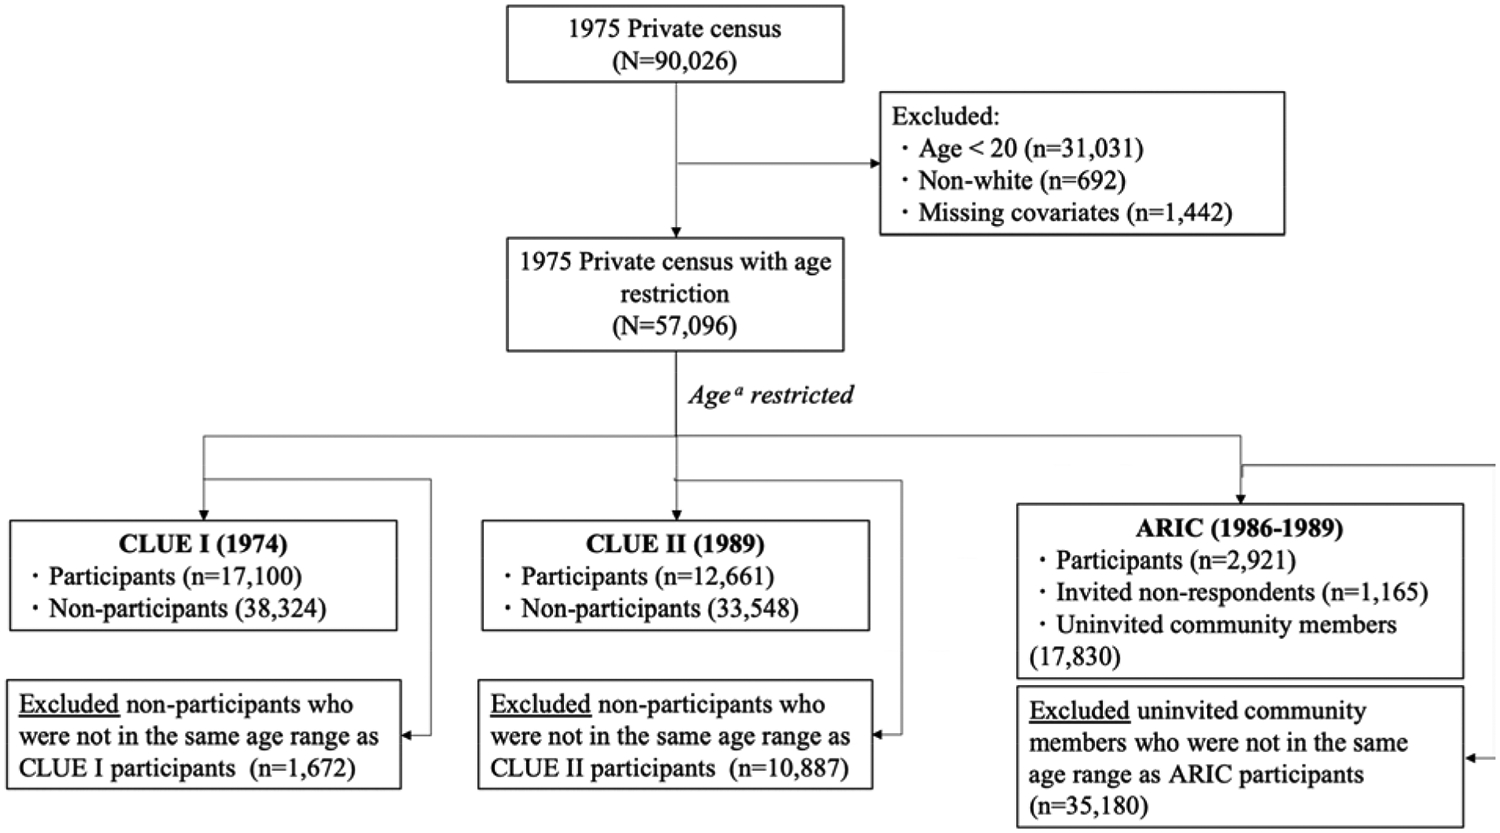
Diagram of the study populations including cohort participants and comparison non-participant groups in the 1975 private census
Official websites use .gov
A
.gov website belongs to an official
government organization in the United States.
Secure .gov websites use HTTPS
A lock (
) or https:// means you've safely
connected to the .gov website. Share sensitive
information only on official, secure websites.
Diagram of the study populations including cohort participants and comparison non-participant groups in the 1975 private census