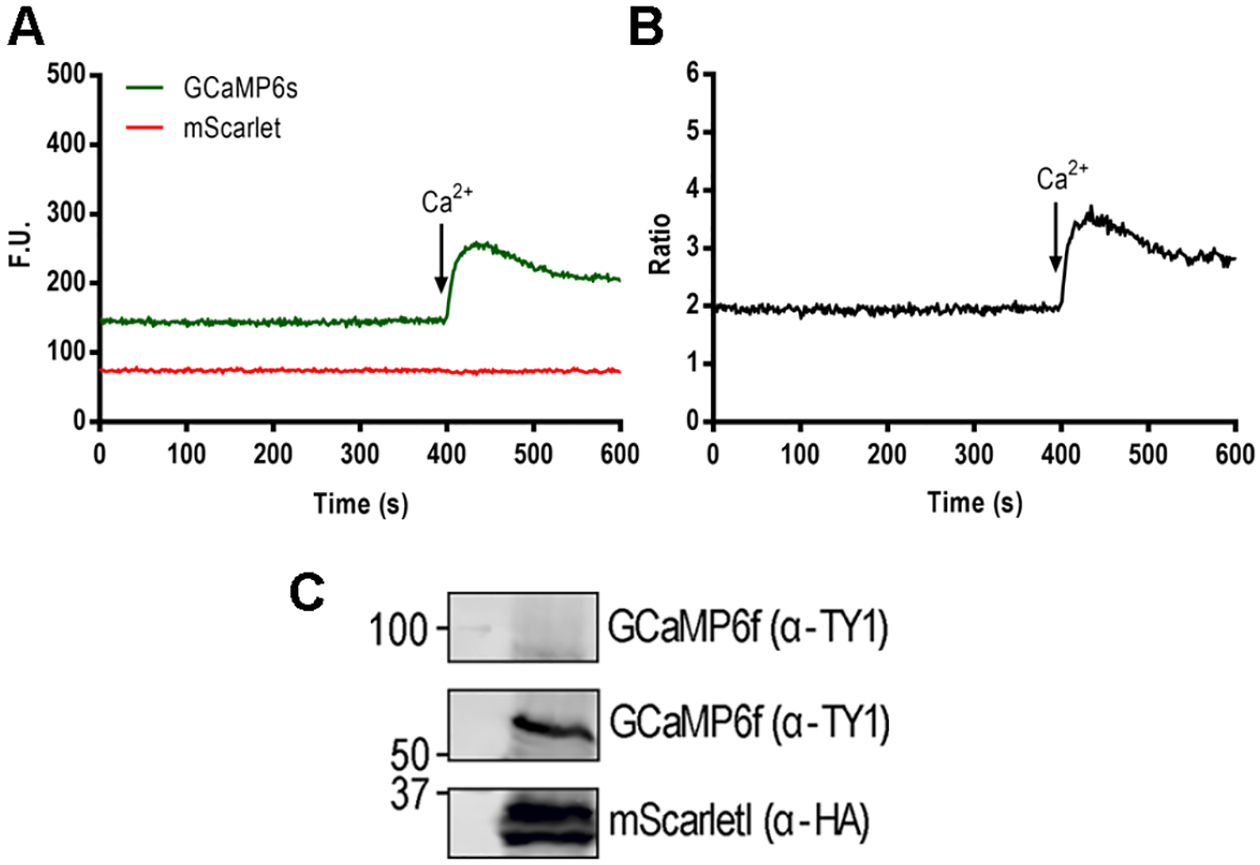
Figure 3: Ratiometric measurements with a clone expressing GCaMP6s-mScarlet.

A, GCaMP and mScarlet fluorescence changes in function of time measured in the F-7000 fluorescence spectrophotometer. A, Parasites at a concentration of 2 × 10⁷ tachyzoites/ml were resuspended in Ringer’s buffer with 100 μM of EGTA at a final volume of 2.5 ml. 1.8 mM of Ca2+ is added at 400 seconds. B, ratio calculation of the fluorescence tracings shown in A. C, Western blots showing the expression of GCaMP6f-Ty1 and mScarletI-3xHA. Antibodies: Mouse α-Ty1 1:2000 (a generous gift from Dr. Etheridge) and Rat α-HA 1:200 (Roche). Secondary: Goat α-mouse IRDye 800 (LI-COR) and Goat α-rat IRDye 680 (LI-COR).
