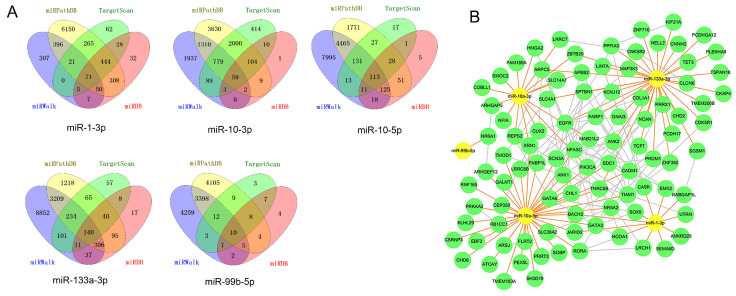
Figure 7.
miRNA-mRNA regulatory network. A, Diagrams illustrating in prediction of target genes of five candidate miRNAs. B, miRNA-mRNA regulatory network. Nodes were color-coded based on components (yellow, DE-miRNAs; green, target DEGs). The orange lines indicated the regulation relationship between DE-miRNAs and their targets DGEs. The silver lines indicated the relationship between DEGs. Abbreviations: DE-miRNAs: differentially expressed miRNAs: DEGs, differentially expressed genes.

