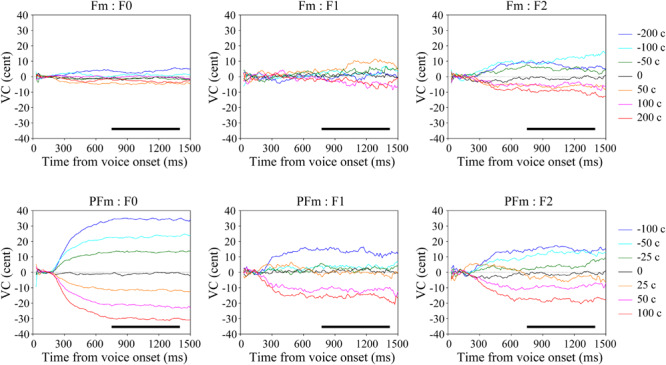
FIGURE 2.

The grand average voice change (VC) of continuous fundamental frequency (F0) and formants (F1–F2) in both types of AF modification conditions. The upper panel shows the results in the formant modification (Fm) conditions and the lower panel shows those in the pitch + formant modification (PFm) conditions. Warm-colored lines represent the frequency-increased conditions and the cold-colored lines represent the frequency-decreased conditions. The black bars show the selected time window (750–1400 ms) with relatively stable vocal responses.
