FIGURE 4.

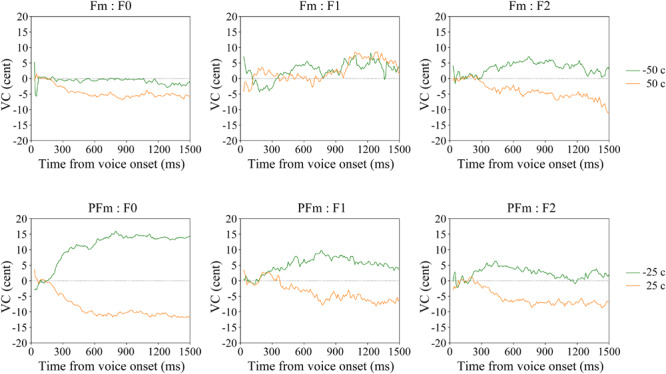
The average VC of continuous F0, F1, and F2 in the Fm and PFm conditions for two subgroups of participants according to their subjective responses.

The average VC of continuous F0, F1, and F2 in the Fm and PFm conditions for two subgroups of participants according to their subjective responses.