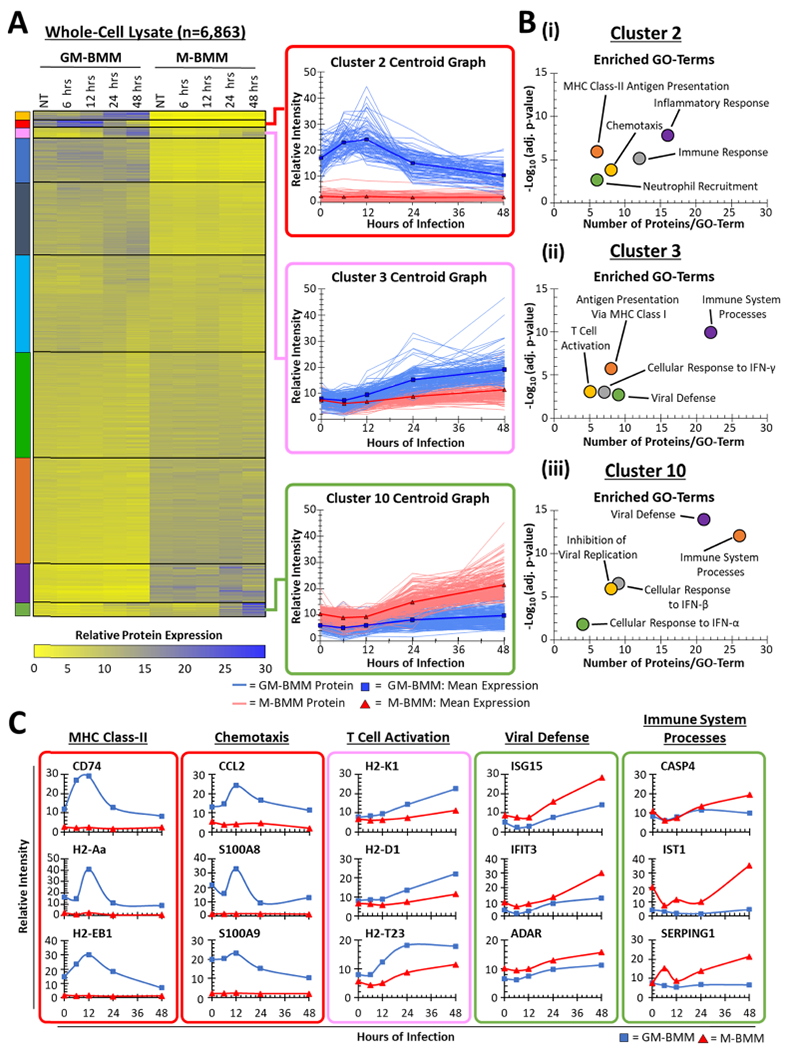
Figure 2.

K-means clustering of GM-BMM and M-BMM proteome data. (A) Heat-map of all 6863 proteins identified within the proteome clustered using K-means with 10 classes. Colored boxes indicate the cluster number. All proteins in each cluster are shown in the inset. (B) DAVID GO-term analysis of individual K-means clusters from (A). (C) Representative proteins within selected GO terms from (B). Colored boxes indicate the associated cluster.
