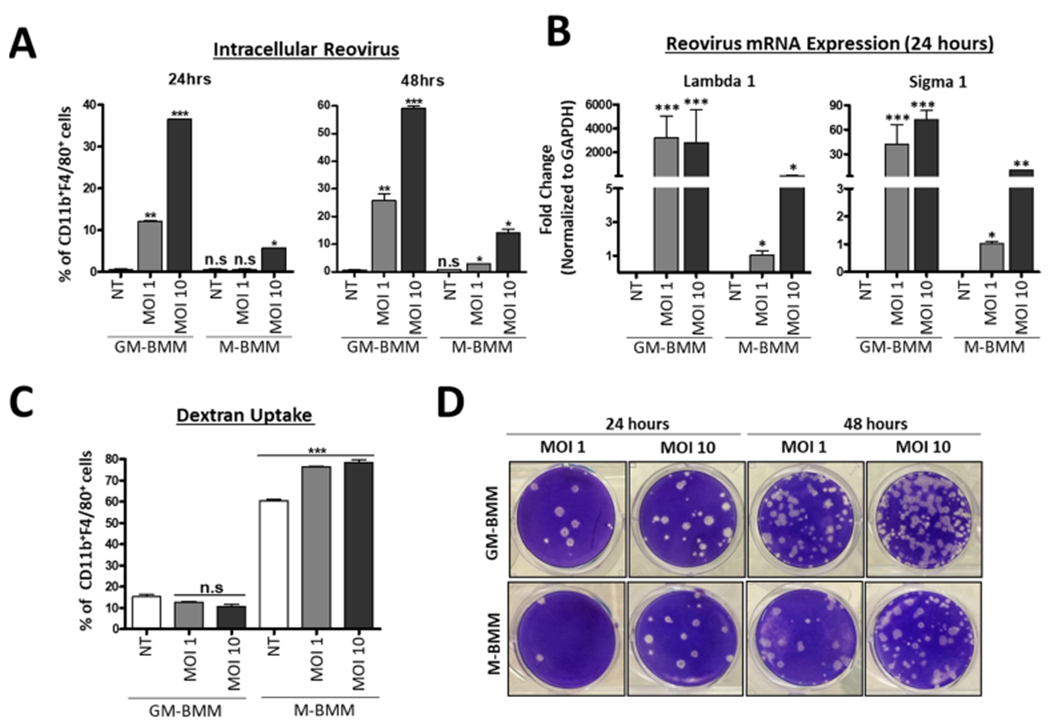
Figure 4.

GM-BMMs display higher susceptibility to reovirus infection than M-BMMs. (A) Flow cytometric analysis of CD11b+ F4/80+ Reovirus+ cells from GM-BMMs and M-BMMs after 24 and 48 h of reovirus infection. (B) GAPDH-normalized RT-PCR quantitation of reovirus Lambda1 and Sigma1 following 24 h of infection. (C) Flow cytometric analysis of CD11b+ F4/80+ FITC–dextran+ uptake between GM-BMMs and M-BMMs after 24 h of infection. (D) Infectivity of virus progeny from GM-BMMs and M-BMMs after 24 and 48 h of infection (1:100 dilution). Statistics were performed using a one-way ANOVA (****p ≤ 0.0001, ***p ≤ 0.0005, **p ≤ 0.001, *p ≤ 0.01, and n.s. = p > 0.05).
