Figure 5.

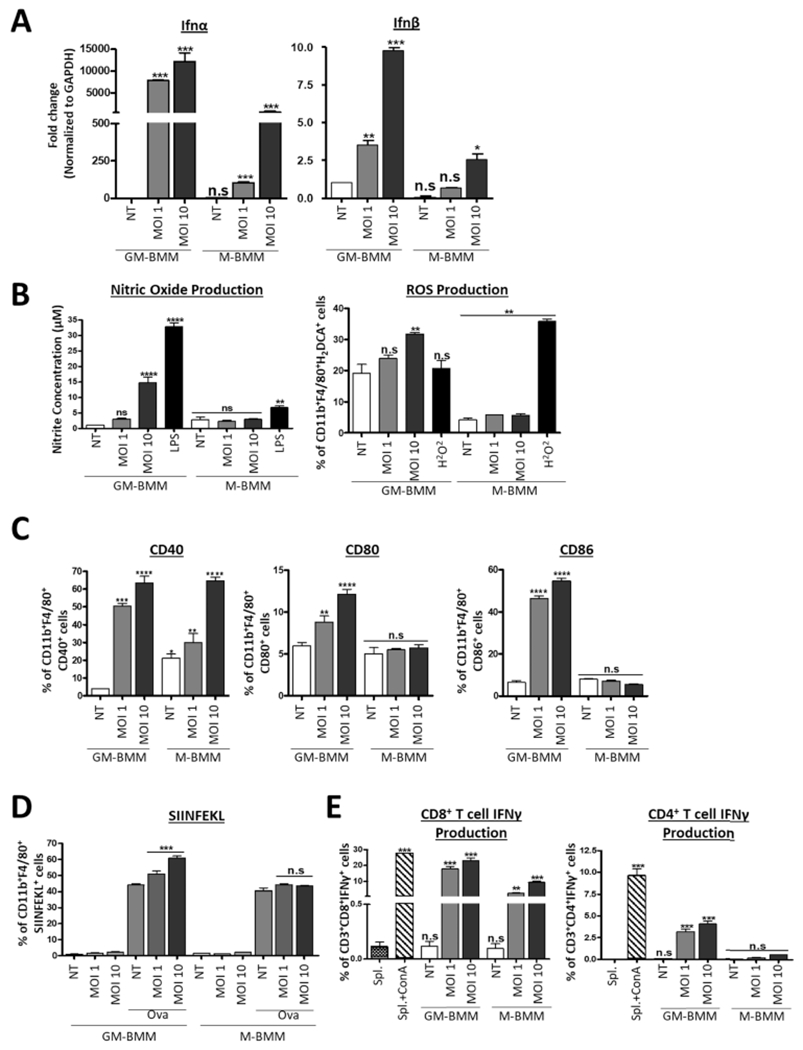
Immunological differences between reovirus-infected GM-BMMs and M-BMMs. (A) qRT-PCR of interferon (IFN)-α and IFN-β in GM-BMMs and M-BMMs after 24 h of reovirus infection. (B) Nitric oxide concentration in GM-BMMs and M-BMMs quantified using the Griess Reagent System and ROS production determination using flow cytometric analysis of DCFDA fluorescence of CD11b+F4/80+ cells. (C) Flow cytometric analysis of co-stimulatory molecule expression on GM-BMMs and M-BMMs after 24 h of infection. Primary gating was on CD11b+F4/80+ cells. (D) Flow cytometric analysis of H2Kb-SIINFEKL in GM-BMMs and M-BMMs cultured in the presence of SIINFEKL after 24 h of reovirus infection. Primary gating was on CD11b+ F4/80+ cells. (E) Flow cytometric analysis of IFNγ+ cells of CD4+ and CD8+ splenic T cell populations from reovirus-infected mice following co-culture with GM-BMMs and M-BMMs. ConA was used as a positive control. Statistical significance was determined using a one-way ANOVA (****p ≤ 0.0001, ***p ≤ 0.0005, **p ≤ 0.001, *p ≤ 0.01, and n.s. = p > 0.05).
