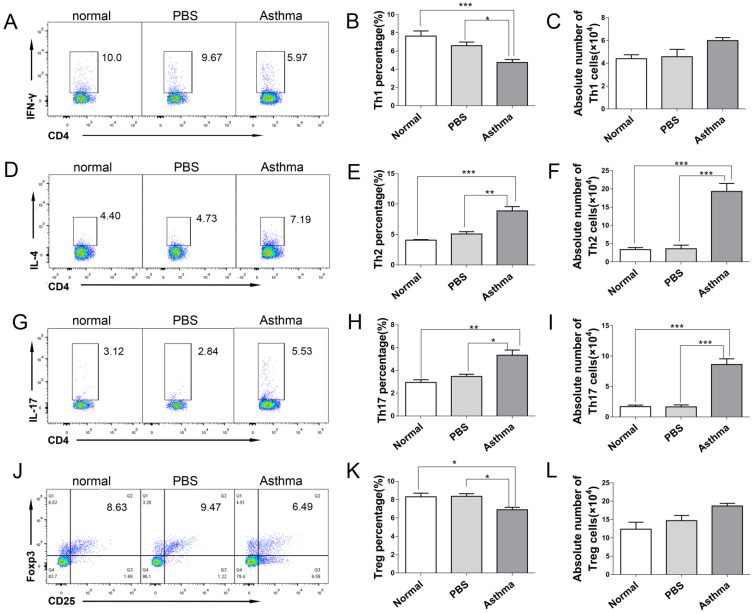
Figure 2.
Th1/Th2/Th17/Treg cell subset distribution in lungs of mice. The single-cell suspensions of lungs in mice were detected for Th1/Th2/Th17/Treg cell subsets by flow cytometry. (A) CD4+IFN-γ+ Th1 cells, (B) Th1 cell percentage, (C) Absolute number of Th1 cells, (D) CD4+IL-4+ Th2 cells, (E) Th2 cell percentage, (F) Absolute number of Th2 cells, (G) CD4+IL-17+ Th17 cells, (H) Th17 cell percentage, (I) Absolute number of Th17 cells, (J) CD4+CD25+Foxp3+ Treg cells, (K) Treg cell percentage, and (L) absolute number of Treg cells each group are shown. The values are mean±SEM of 12 mice from two independent experiments. *P < 0.05, **P < 0.01, ***P < 0.001.

