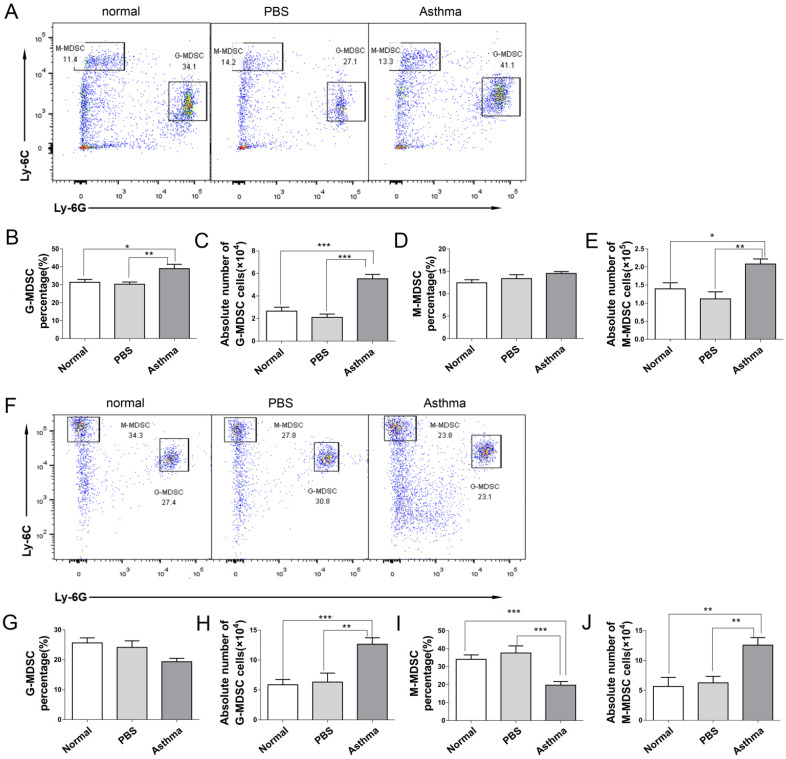
Figure 3.
MDSC subset distribution in splenocytes and lungs of mice. The splenocytes and the single-cell suspensions of lungs in mice were tested for CD11b+Ly6G-Ly6Chigh M-MDSC and CD11b+Ly6G+Ly6Clow G-MDSC subsets by flow cytometry. (A) Representative flow cytometry results are shown in splenocytes of mice. (B) G-MDSC percentage, (C) Absolute number of G-MDSCs, (D) M-MDSC percentage and (E) Absolute number of M-MDSCs in splenocytes of each group are shown. (F) Representative flow cytometry results are shown in lungs of mice. (G) G-MDSC percentage, (H) Absolute number of G-MDSCs, (I) M-MDSC percentage and (J) Absolute number of M-MDSCs in lungs of each group are shown. The values are mean±SEM of 12 mice from two independent experiments. *P < 0.05, **P < 0.01, ***P < 0.001.

