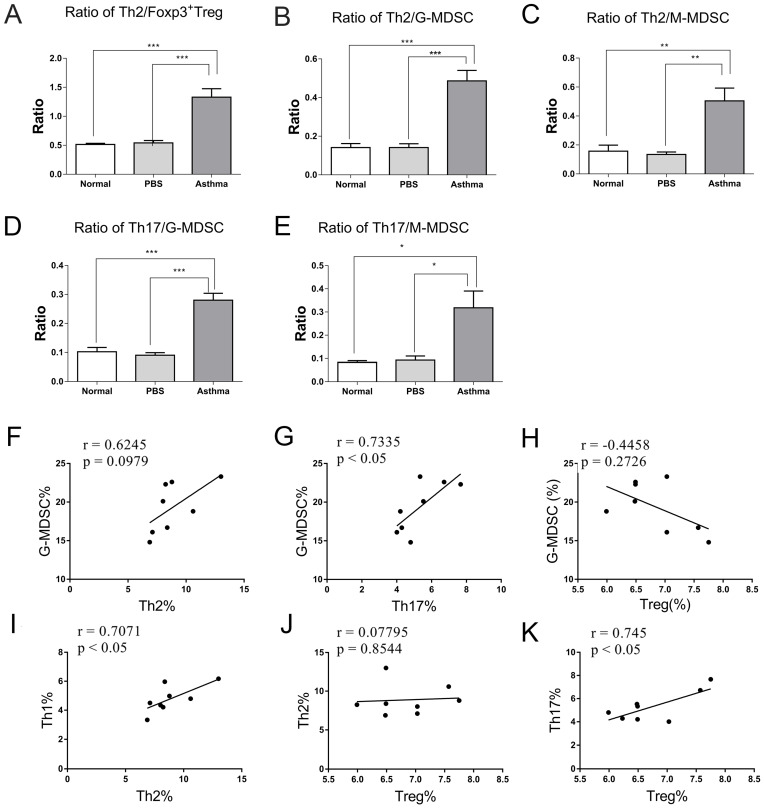
Figure 5.
Ratios and relationships among Th1, Th2, Th17, Treg, G-MDSC, and M-MDSC in mice. (A) Ratios of Th2/Treg, (B) Th2/G-MDSC, (C) Th2/M-MDSC, (D) Th17/G-MDSC, and (E) Th17/M-MDSC in each group are shown. The values are mean±SEM of 12 mice from two independent experiments. *P < 0.05, **P < 0.01, ***P < 0.001. (F) Relationship of G-MDSCs with Th2 cells, (G) G-MDSCs with Th17 cells, and (H) G-MDSCs with Treg cells in asthmatic mice. (I) Relationship of Th1 cells with Th2 cells, (J) Th2 cells with Treg cells, and (K) Th17 cells with Treg cells in asthmatic mice (n=8).

