
Figure 6. Cluster 3 and 4 clones drive host myofibroblast activation.
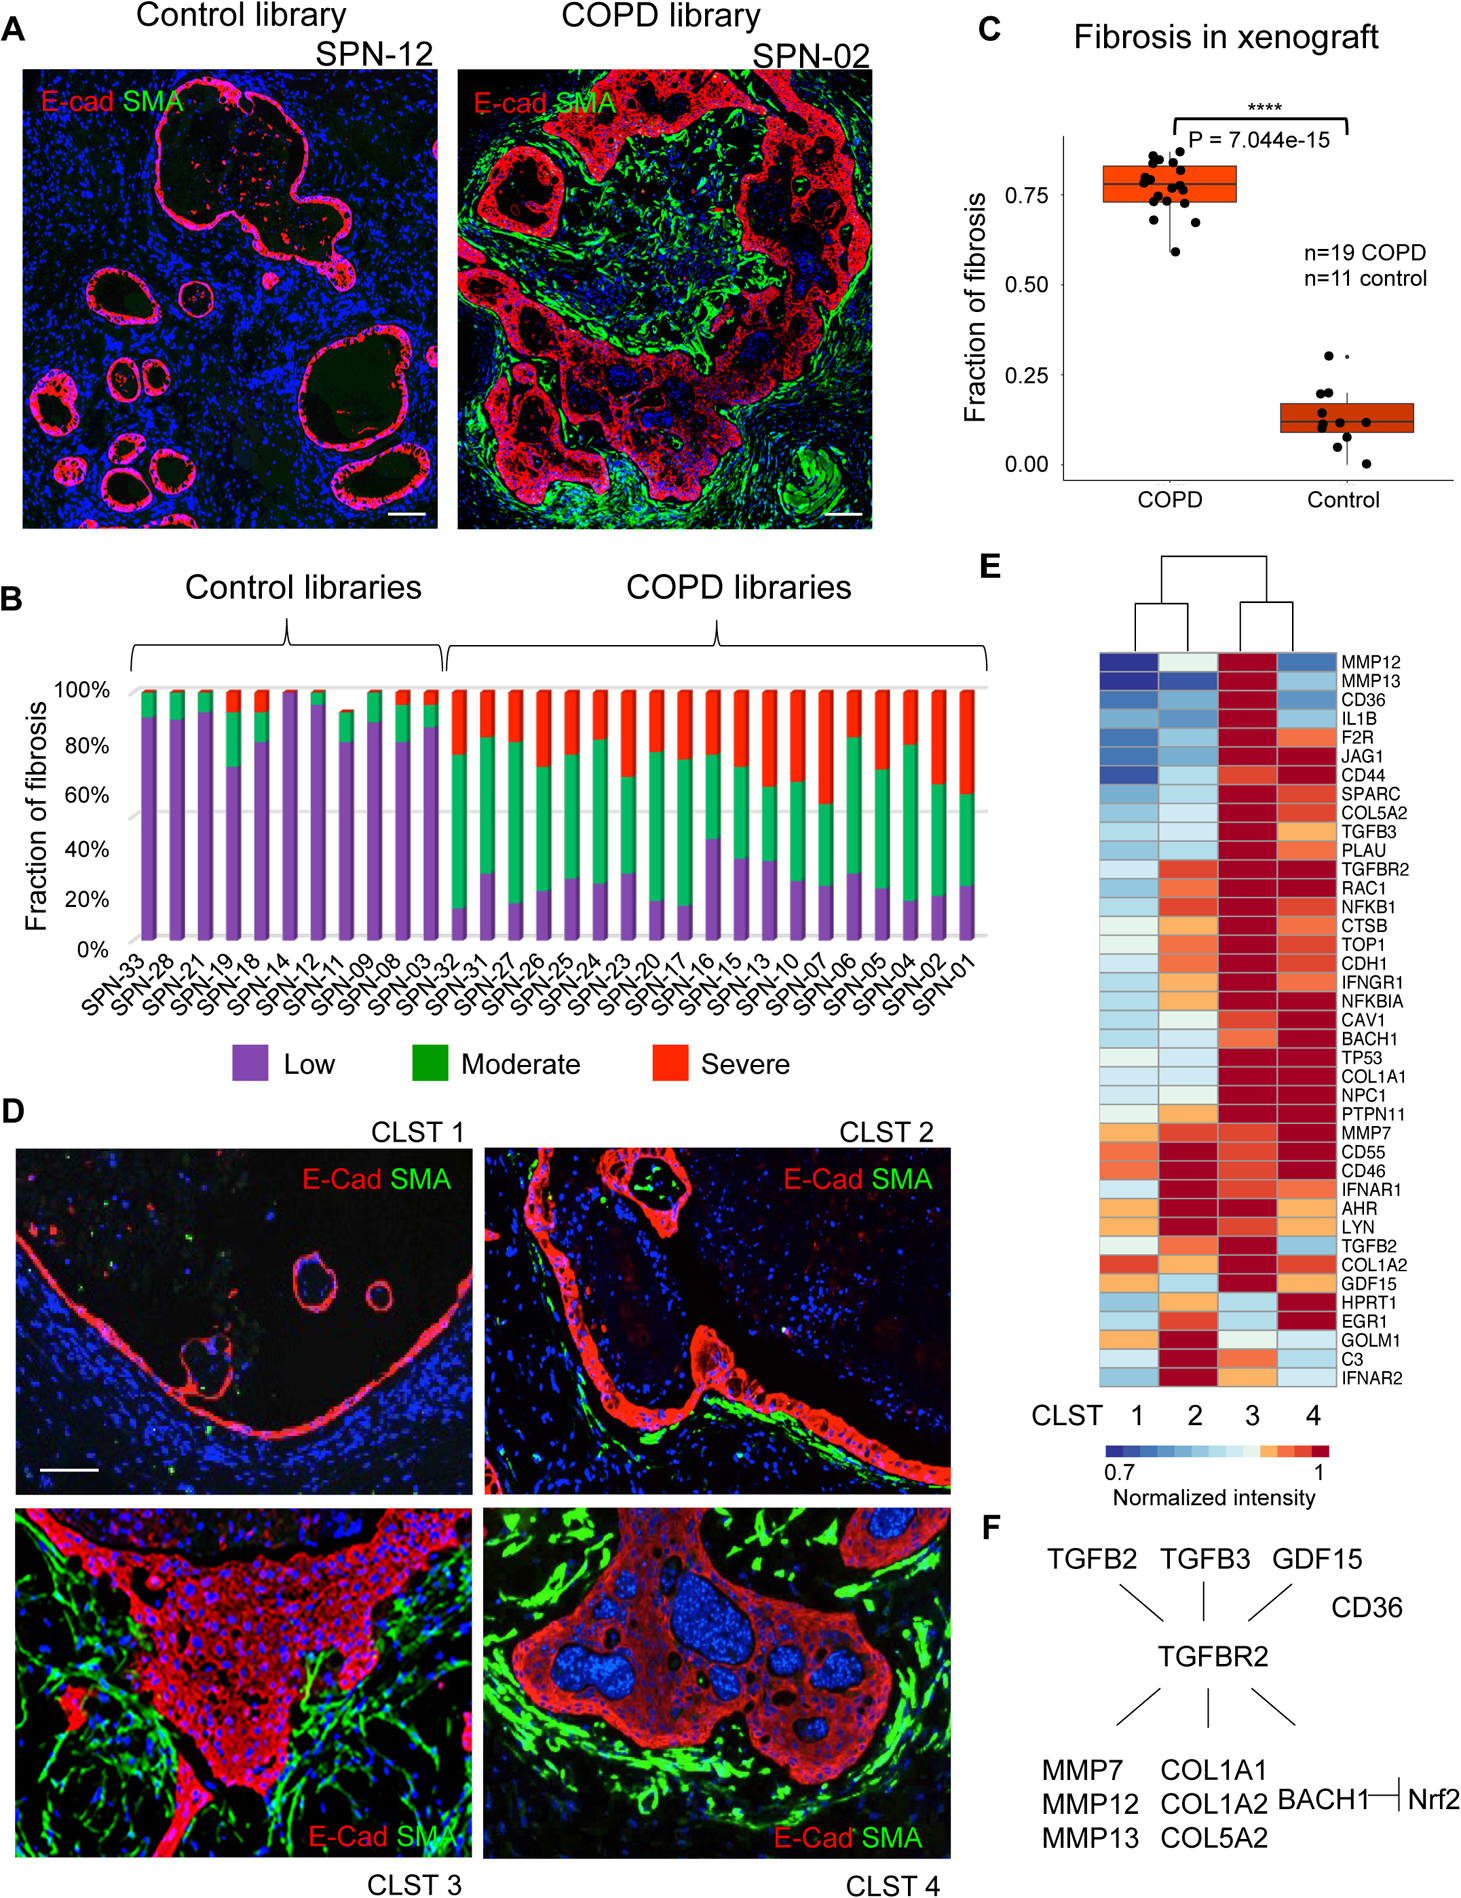
A. Immunofluorescence micrographs of xenografts derived from control case (SPN-12; left) and COPD case (SPN-02; right) clone libraries stained with antibodies to the myofibroblast marker alpha-smooth muscle actin (SMA). Scale bar, 200 μm. B. Quantification of myofibroblast submucosal accumulation in xenografts based on general scale applied to cysts within 11 control and 19 COPD clone library transplants. C. Box-Whisker plot representation of fibrosis accumulation about cysts in each of 19 COPD and 11 control library xenografts (P = 7.0e-15, Student’s t-test). D. Immunofluorescence micrographs of xenografts derived from patient-matched clones of Clusters 1–4 using antibodies to E-cadherin (ECAD, red) and alpha-smooth muscle actin (SMA, green). Scale bar, 100 μm. E. Differential expression heatmap of fibrosis-related genes (1.5-fold, p<0.05) of xenografts derived from patient-matched clones representative of Clusters 1–4. F. Schematic TGF-β pathway including genes differentially expressed in clones of Clusters 3 and 4. See also Figure S6.