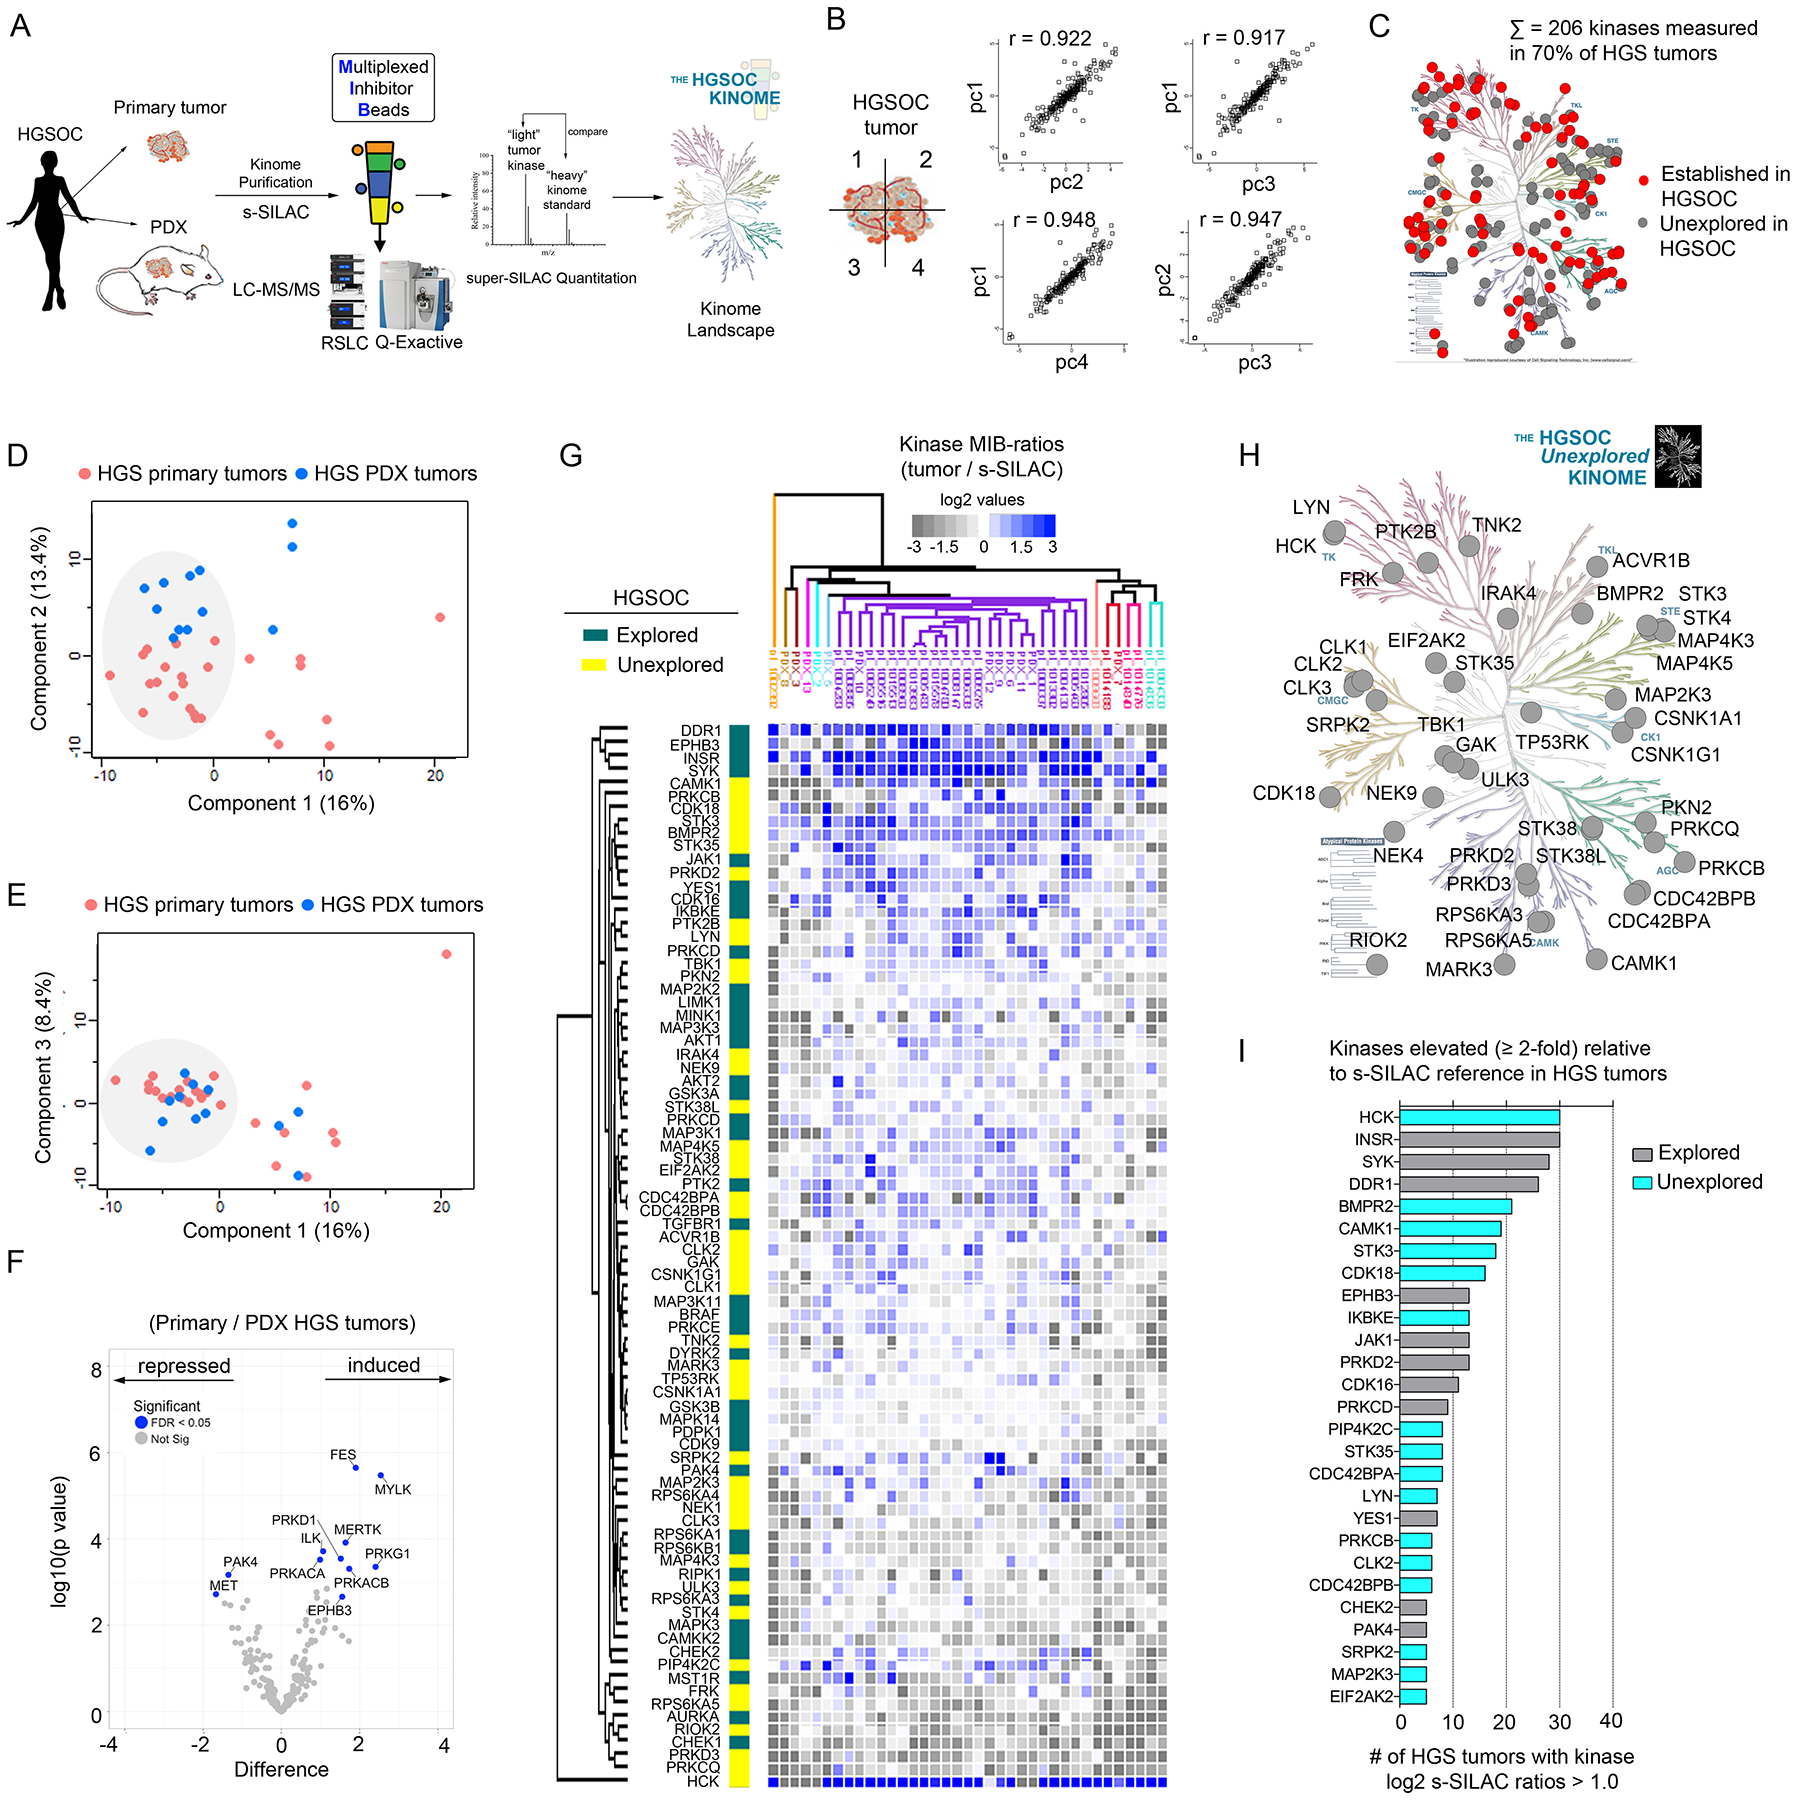
Figure 1. Characterizing the HGSOC kinome in patient tumors using MIB-MS to identify previously unexplored therapeutic targets.

(A) Schematic of experimental approach. MIB-MS was used to quantify kinase abundance in HGSOC patient tumors to map the proteomic landscape of the kinome and identify prevalent kinases previously unexplored in HGSOC. (B) Measurement of kinase abundance in a patient HGSOC tumor sectioned into 4 pieces, each individually kinome-profiled by MIB-MS, and kinase abundance was determined by s-SILAC quantitation. Pearson’s correlation thereof was determined using Perseus. (C) Proportion of the kinome quantitated by MIB-MS in HGSOC (“HGS”) tumors that represent established (red) and unexplored (gray) targets in HGSOC. Data are from one independent assay per sample in 25 tumor tissues and 10 PDX tumor tissues. The kinome tree was generated in KinMap and was reproduced courtesy of Cell Signaling Technology. (D and E) PCA analysis, including PC1 vs PC2 (D) and PC1 vs PC3 (E), of MIB-MS determined kinome profiles of HGSOC primary and PDX tumors. Data are from one independent assay per sample in 25 tumor tissues and 10 PDX tumor tissues. (F) Volcano plot comparison of HGSOC primary and PDX tumor MIB-MS kinome profiles. Statistical differences in kinase log2 s-SILAC ratios comparing HGSOC primary vs PDX tumors was determined by paired t-test Benjamini-Hochberg adjusted p values at FDR of <0.05. Data are from one independent assay per sample in 25 tumor tissues and 10 PDX tumor tissues. (G) Predominant kinome signature identified by MIB-MS amongst HGSOC patient and PDX tumors, representing kinases detected at similar abundances amongst tumors. Statistical differences in kinase log2 s-SILAC ratios comparing HGSOC tumors from the main cluster relative to others was determined by paired t-test Benjamini-Hochberg adjusted p values at FDR of <0.05. Heat map depicts kinase log2 s-SILAC ratios, highlighting established HGSOC drivers, including those with drugs approved or in clinical trials, as well as those previously unexplored in HGOSC. Data are from one independent assay per sample in 25 tumor tissues and 10 PDX tumor tissues. (H) Kinases previously unexplored in HGSOC enriched in the MIB-MS kinome signature from (G). Data are from one independent assay per sample in 25 tumor tissues and 10 PDX tumor tissues. Kinome plot produced using KinMap. The kinome tree was reproduced courtesy of Cell Signaling Technology. (I) Bar graph depicting kinases that were increased ≥ 2-fold relative to the s-SILAC reference in HGSOC tumors. The number of HGSOC tumors with kinases exhibiting log2 s-SILAC values (≥ 1.0) was determined, and the bar graph was generated in Prism software. Related data (additional PCA, correlation, and hierarchical clustering of MIB-MS profiles of primary and PDX HGSOC tumors) can be found in figure S1.
