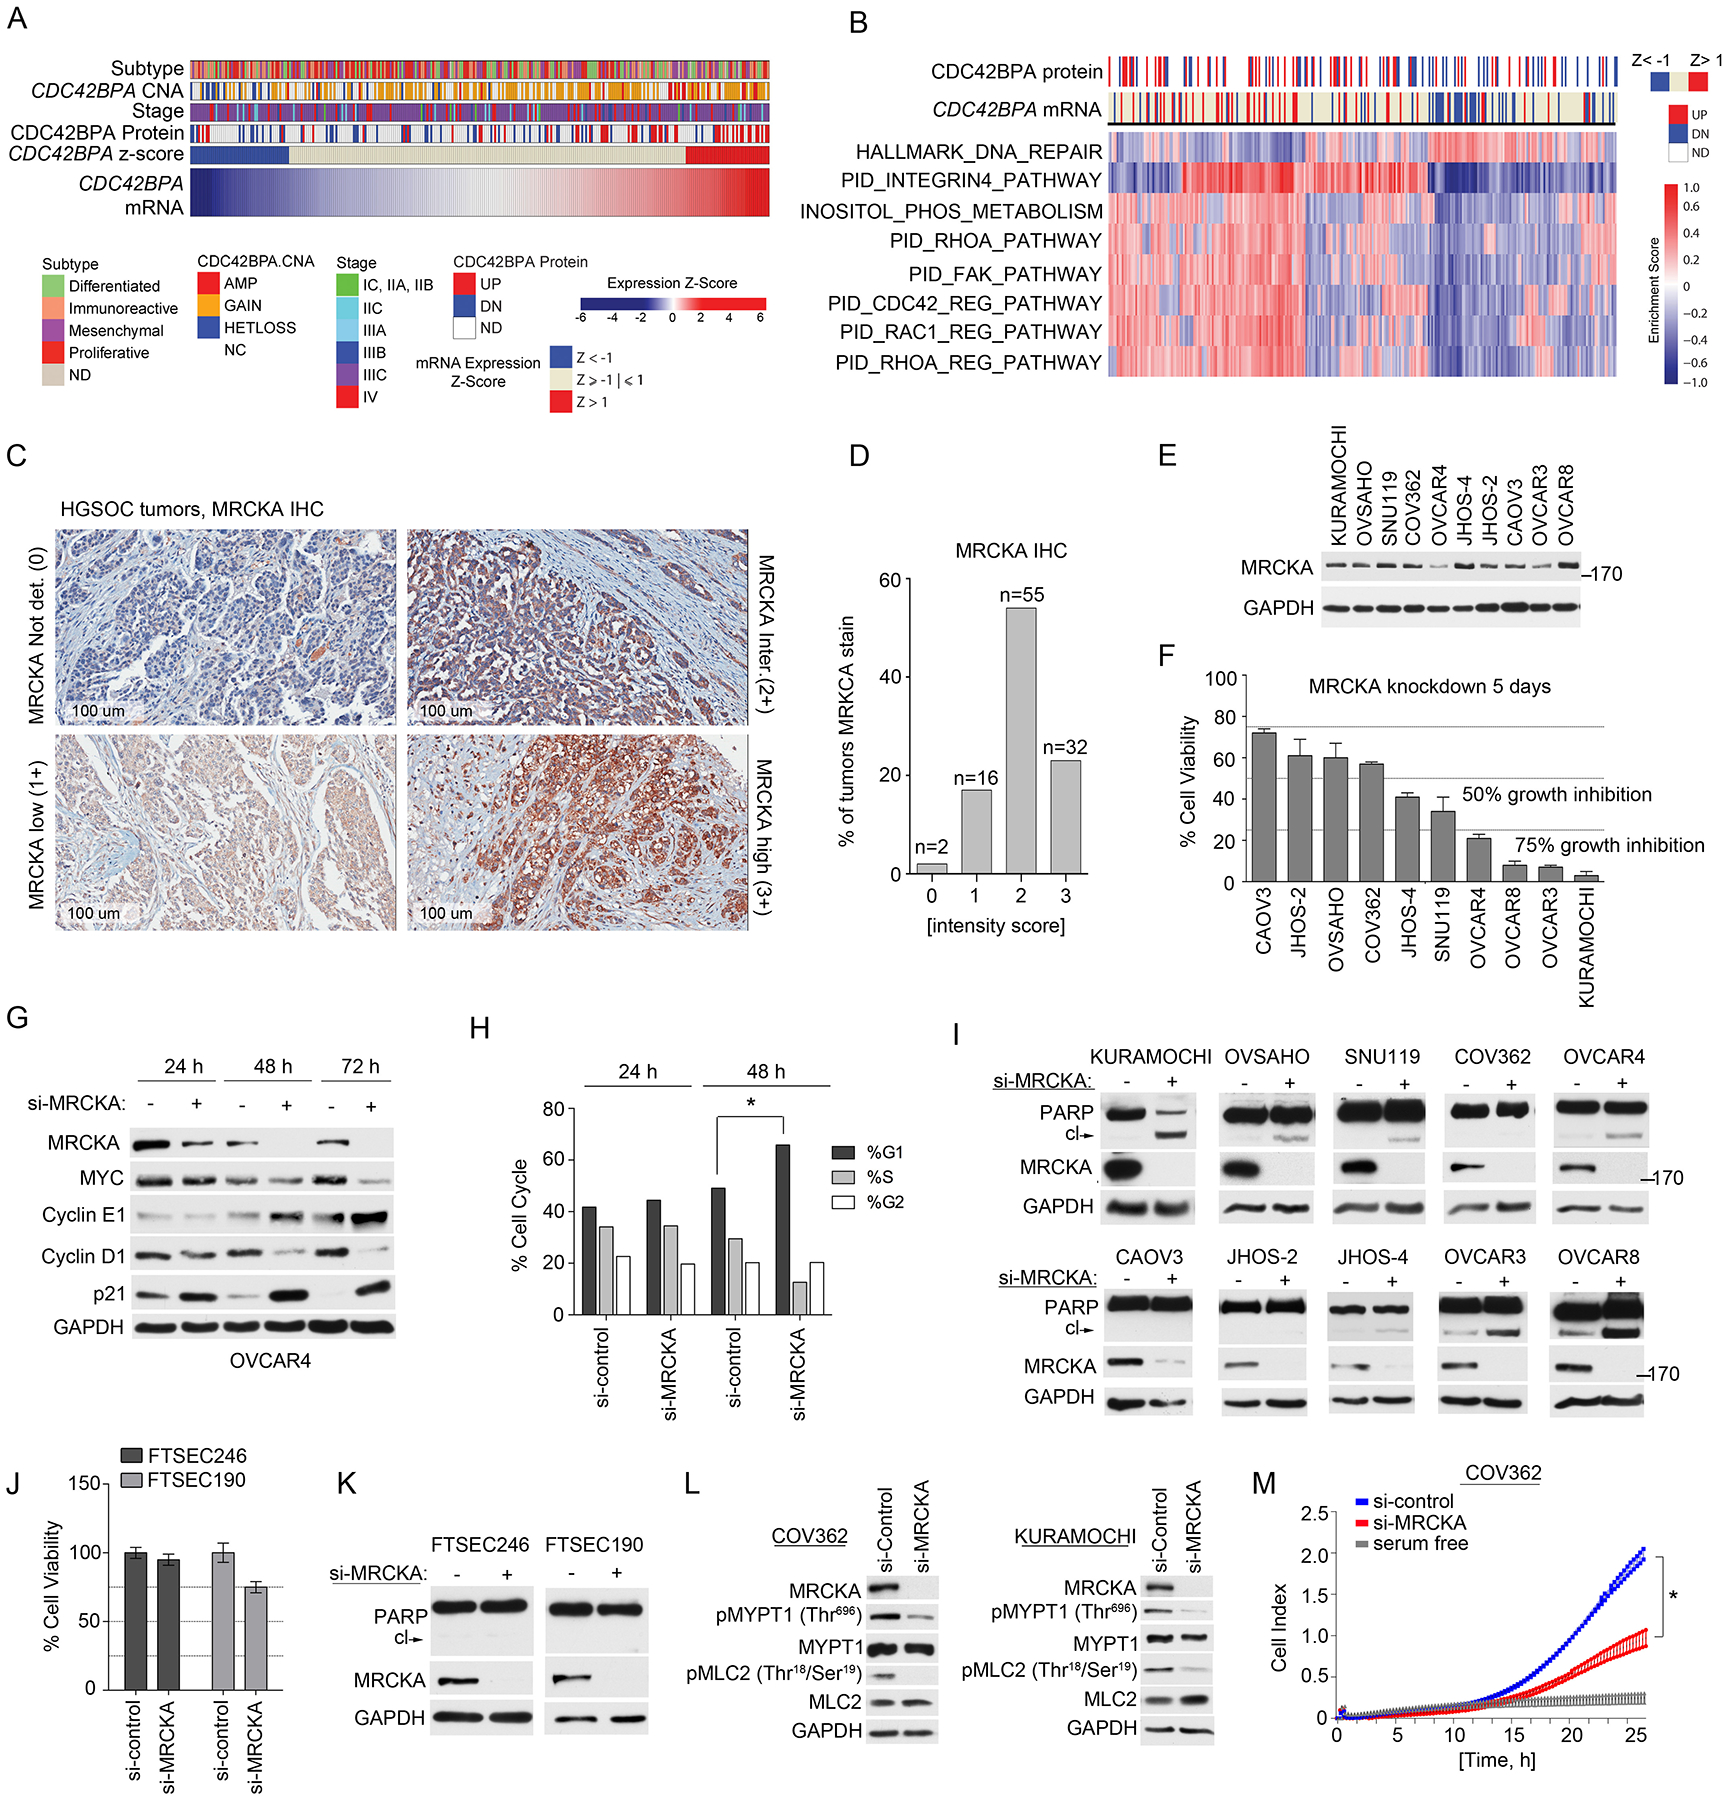
Figure 3. MRCKA is highly expressed amongst HGSOC tumors and promotes growth and survival of HGSOC cell lines.

(A) Analysis of CDC42BPA copy number analysis (CNA), mRNA and protein expression changes in HGSOC tumors from TCGA and CPTAC studies (1, 18). mRNA levels determined by U133 microarray and protein level determined by mass spectrometry. Change in MRCKA abundance amongst tumors determined at z-score > 1 or < −1. Molecular subtype of HGSOC and disease stage are presented in relation to MRCKA mRNA levels. (B) Gene set enrichment analysis of HGSOC tumors expressing high or low CDC42BPA mRNA levels. Detailed description of bioinformatics methods described in Materials and Methods. (C and D) IHC analysis of MRCKA in HGSOC TMA’s. Immunoreactivity of MRCKA protein was evaluated by a pathologist and IHC score was given based on the intensity of protein stain. 0: Negative; 1+: mild(low)/weak; 2+: moderate/intermediate; 3+: Strong(high)/intensive. MRCKA IHC images captured at 100 um. Data are from duplicate analysis of 105 tumor tissues. (E) MRCKA protein abundance amongst HGSOC cell lines determined by immunoblot. Blots are representative of 3 independent experiments. (F) Cell-Titer Glo assay for cell viability of HGSOC cells transfected with siRNAs targeting MRCKA or control siRNAs and cultured for 120 hours. Data were analyzed as % cell viability of siRNA control treated cells; presented as means ± SD of 3 independent assays. (G) Immunoblot analysis for cell cycle markers in OVCAR4 cells transfected with MRCKA or control siRNAs for 24, 48 or 72 hours. Blots are representative of 2 independent experiments. (H) FACS analysis of OVCAR4 cells transfected with MRCKA or control siRNAs collected at the indicated time points. The cells were analyzed with a FACScan (BD) flow cytometer and the data were analyzed using FlowJo (BD). Data were analyzed as % phase of cell cycle; presented as means ± SD of 3 independent assays. *P≤0.05 by Student’s t-test. (I) Apoptosis assessed by immunoblotting for cleaved-PARP abundance in HGSOC cells transfected with siRNAs targeting MRCKA or control siRNA and cultured for 72 hrs. PARP cleavage and MRCKA protein levels were determined by western blot. Blots are representative of 3 independent experiments. (J) Cell-Titer Glo assay for cell viability of FTSEC cells transfected with siRNAs targeting MRCKA or control siRNAs and cultured for 120 hours. Data were analyzed as % cell viability of siRNA control treated cells; presented as means ± SD of 3 independent assays. (K) Apoptosis assessed by immunoblotting for cleaved-PARP abundance in FTSEC cells transfected with siRNAs targeting MRCKA or control siRNA and cultured for 72 hours. Blots are representative of 3 independent experiments. (L) Immunoblot analysis of MLC2 and MYPT1 phosphorylation in COV362 and KURAMOCHI cells transfected with MRCKA or control siRNAs for 72 hours. Blots are representative of 3 independent experiments. (M) Analysis of cell migration in COV362 cells transfected with MRCKA or control siRNAs and cultured for 72 hours. Migration monitored over a 24-hour period using the xCELLigence Real-Time Cell Analyzer (RTCA). Data were analyzed as cell index; presented as means ± SD of 3 independent assays. *P≤0.05 by Student’s t-test. Related data (impact of MRCKA expression on overall survival of HGSOC, gene set enrichment analysis, IHC of MRCKA in fallopian tube and ovarian surface epithelium, and immunoblot analysis of MRCKA protein abundance in HGSOC tumors and HGSOC cell lines) can be found in figure S2.
