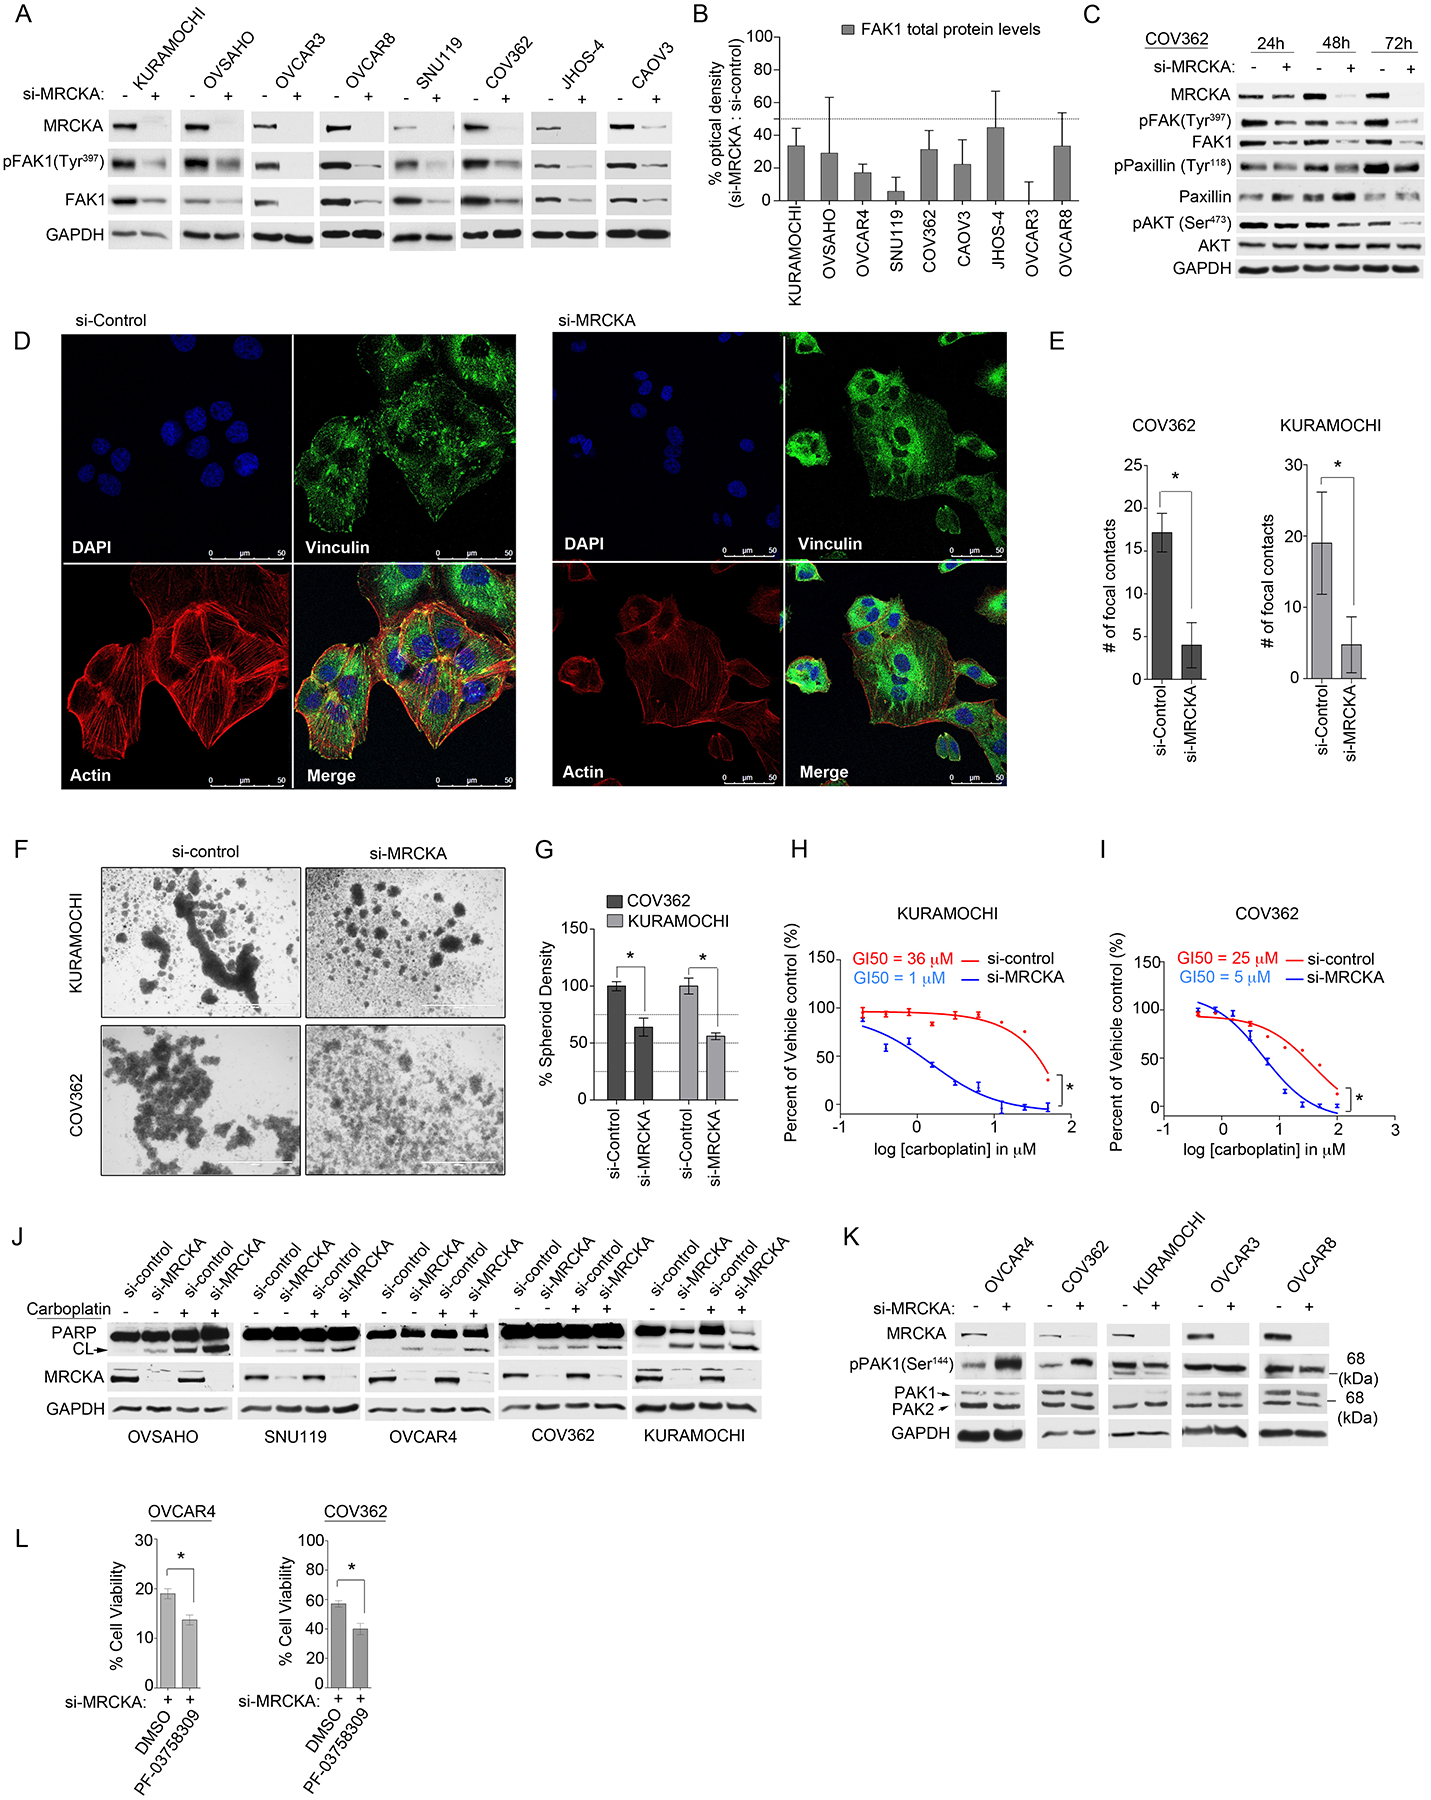
Figure 5. MRCKA knockdown blocks focal adhesion signaling impairing spheroid formation and sensitizes HGSOC cells to carboplatin or PAK inhibitors.

(A) Immunoblot analysis of FAK1 activating phosphorylation and total FAK1 protein abundance in HGSOC cells transfected with control or MRCKA siRNAs for 72 hours. Blots are representative of 3 independent experiments. (B) Densitometric analysis of immunoblots presented in (A). Values indicate the optical density of total protein levels from an immunoblot normalized to total protein content (loading control, GADPH) expressed as a percent change (si-MRCKA / si-control). Quantitation of immunoblot bands was performed in ImageJ using 3 independent biological replicates. (C) Immunoblot analysis of focal adhesion signaling markers in COV362 cells transfected with MRCKA or control siRNAs for 24, 48 or 72 hours. Blots are representative of 2 independent experiments. (D) Confocal fluorescence microscopy of focal adhesion and actin cytoskeleton in COV362 cells transfected with MRCKA or control siRNAs 72 hours. (DAPI) nuclear staining by DAPI, (Vinculin) focal contacts revealed by anti-vinculin antibody, (Actin) F-actin detected by TRITC-conjugated phalloidin and (Merge) merged stain of DAPI, phalloidin and vinculin. Images are representative of 3 independent experiments. Scale bar = 50 μm. (E) Quantitation of focal adhesion contacts in COV362 and KURAMOCHI cells transfected with MRCKA or control siRNAs 72 hrs. Data were analyzed as number of focal contracts; presented as means of 3 independent assays. *P≤0.05 by Student’s t-test. (F and G) Assessment of spheroid formation in COV362 and KURAMOCHI cells transfected with MRCKA or control siRNAs 72 hrs. Representative microscope images of KURAMOCHI or COV362 spheroids from 3 independent biological replicates. Scale bar = 1000 μm. (G) Quantitation of spheroid density determined by ImageJ. *P≤0.05 by Student’s t-test. (H and I) Cell-Titer Glo assay for cell viability of KURAMOCHI (H) or COV362 (I) cells transfected with siRNAs targeting MRCKA or control siRNAs, cultured for 72 hours (KURAMOCHI) or 120 hrs (COV362) and treated with increasing doses of carboplatin or DMSO. Data were analyzed as % of DMSO control; presented as means of 3 independent assays. GI50 were determined using PRISM. (J) Apoptosis assessed by immunoblotting for cleaved-PARP abundance in HGSOC cells transfected with siRNAs targeting MRCKA or with control siRNAs, cultured for 72 hours and treated with carboplatin (25 μM) or DMSO. Blots are representative of 2 independent experiments. (K) Immunoblot analysis of phosphorylated and total levels of PAK1 in HGSOC cells transfected with MRCKA or control siRNAs 72 hours. Blots are representative of 3 independent experiments. *P≤0.05 by Student’s t-test. (L) Cell-Titer Glo assay for cell viability of OVCAR4 or COV362 cells transfected with siRNAs targeting MRCKA or control siRNAs, cultured for 120 hrs and treated with PF-03758309 (3.5 nM, OVCAR4 or 50 nM, COV362) or DMSO. Data were analyzed as % of DMSO control; presented as means of 3 independent assays. Related data (immunoblot analysis of FAK1 protein levels using 2-distinct siRNAs, FAK1 mRNA levels following MRCKA-knockdown, confocal fluorescence microscopy of focal adhesion and actin cytoskeleton in KURAMOCHI cells, and Bliss synergy analysis of carboplatin and MRCKA siRNA drug synergy) can be found in figure S4.
