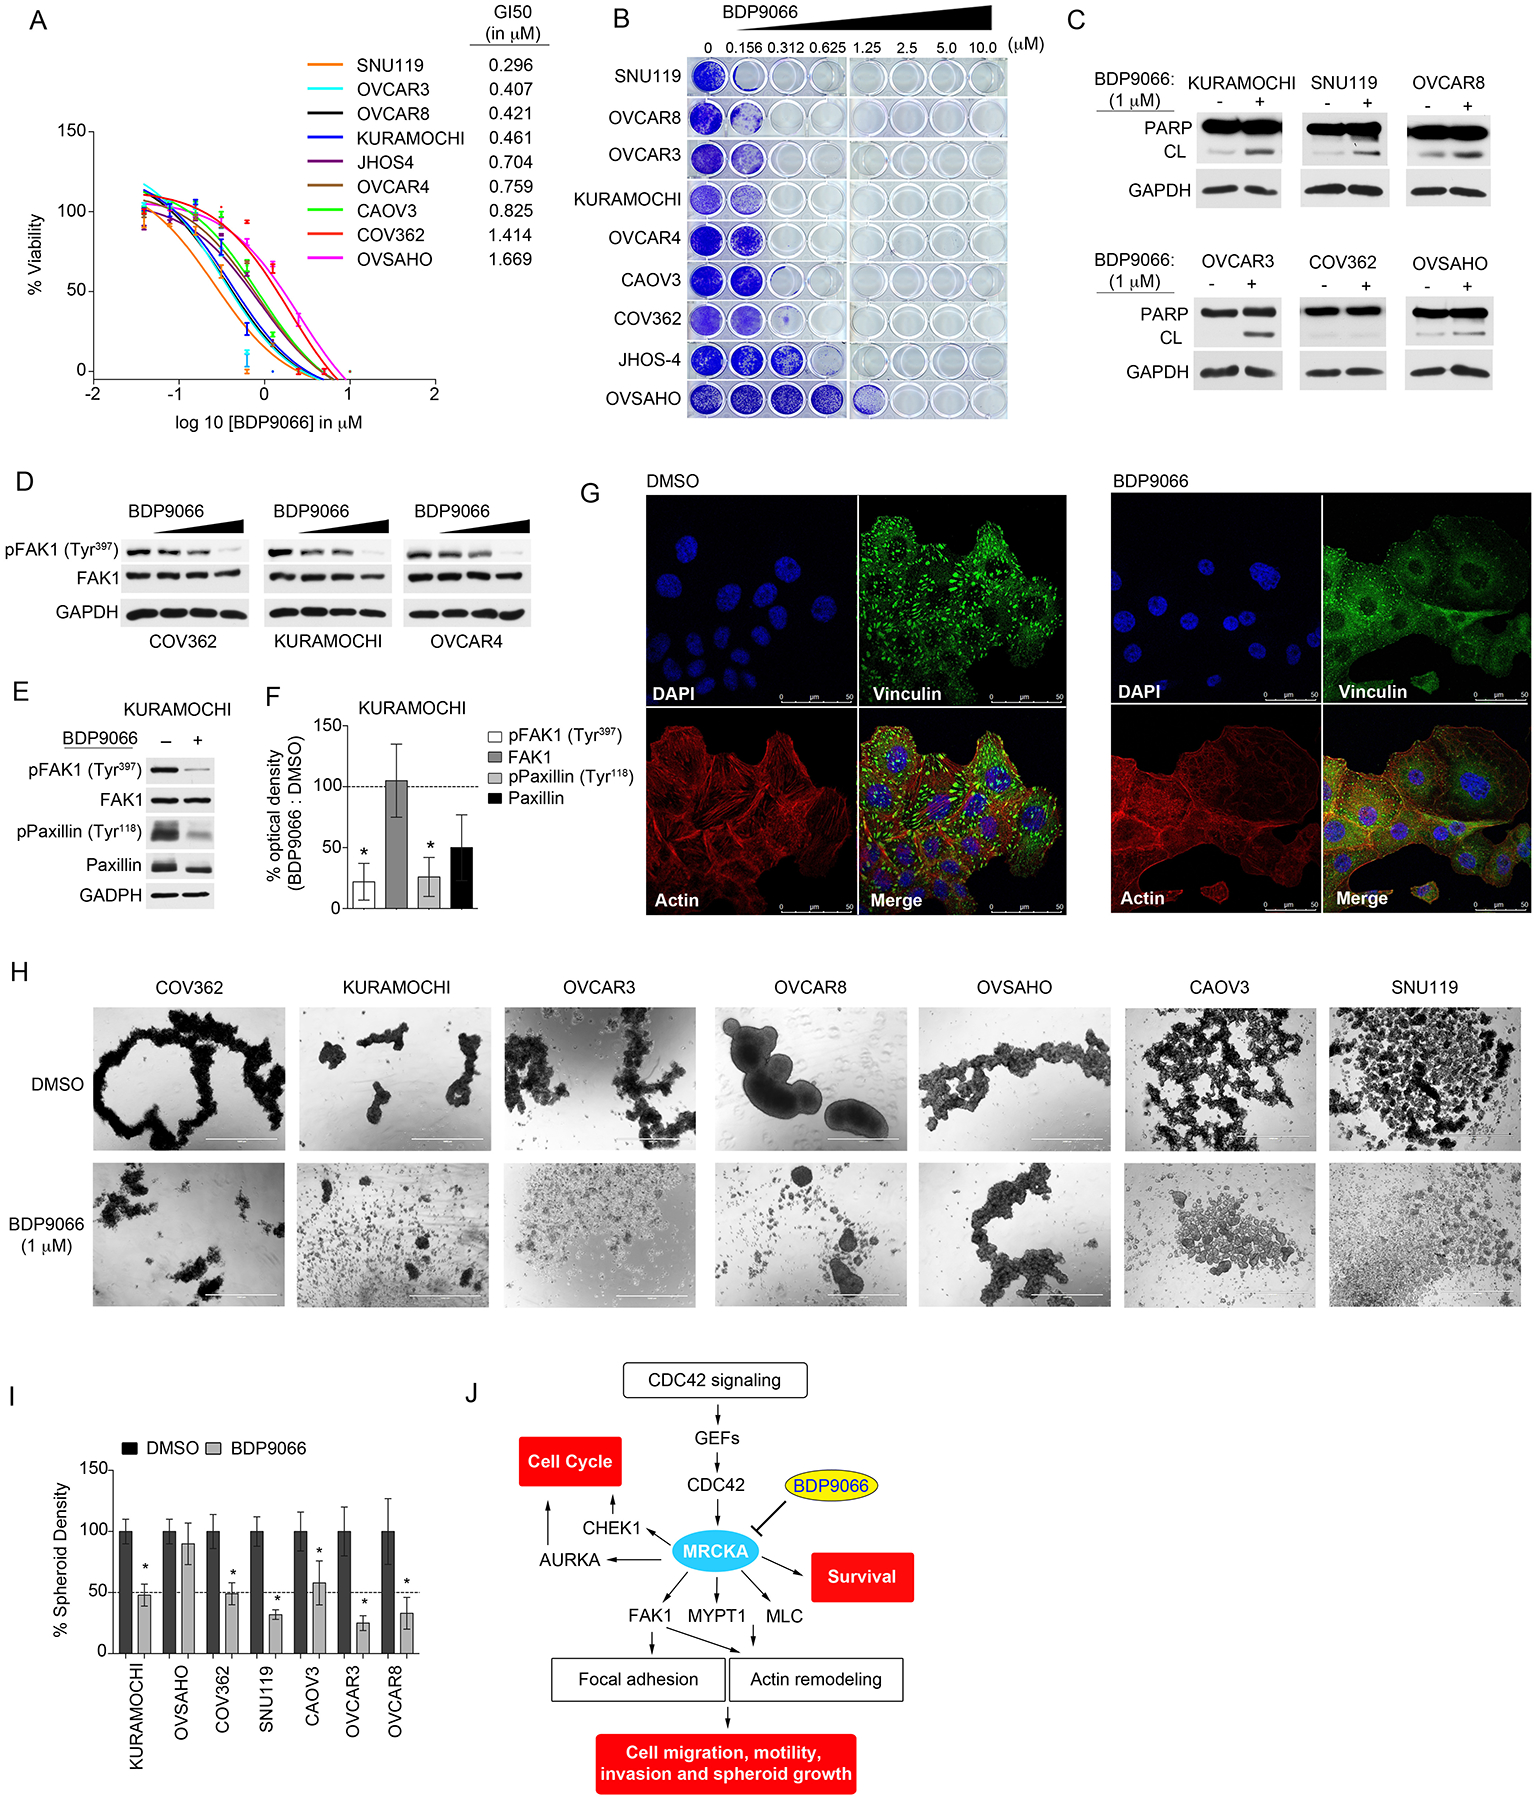
Figure 7. Treatment of HGSOC cells with BDP9066 blocks cell growth, induces apoptosis and inhibits focal adhesion signaling impairing spheroid formation of HGSOC cells.

(A) Cell-Titer Glo assay for cell viability of HGSOC cell lines treated with increasing concentrations of BDP9066 or DMSO and cultured for 120 hours. Data were analyzed as % cell viability of DMSO control; presented as means of 3 independent assays. GI50 values for BDP9066 were generated in Prism. (B) Long-term 14-day colony formation assay of HGSOC cells treated with BDP9066 or DMSO. Colony formation was assessed by crystal violet staining. Representative images of 3 biological replicates. (C) Apoptosis assessed by immunoblotting for cleaved-PARP abundance in HGSOC cells treated with DMSO or 1 μM of BDP9066 for 72 hours. Blots are representative of 3 independent experiments. (D) Immunoblot analysis of FAK1 phosphorylation and total FAK1 protein abundance in HGSOC cells treated with escalating doses of BDP9066 (0, 0.5, 1 and 3 μM) for 48 hours. Blots are representative of 3 independent experiments. (E) Immunoblot analysis of phosphorylation of FAK1 and Paxillin in HGSOC cells treated with 2 μM BDP9066 for 48 hours. Blots are representative of 3 independent experiments. (F) Densitometric analysis of immunoblots presented in (E). Values indicate the optical density of phosphorylated or total protein levels from an immunoblot normalized to total protein content expressed as a percent change (BDP9066/DMSO). Phosphorylated proteins were normalized to loading control, then normalized to total abundance of the respective protein. Quantitation of immunoblot bands was performed in ImageJ using 3 independent biological replicates. *P≤0.05 by Student’s t-test. (G) Confocal fluorescence microscopy of focal adhesion and actin cytoskeleton in KURAMOCHI cells treated with DMSO or 1 μM BDP9066 for 24 hours. (DAPI) nuclear staining by DAPI, (Vinculin) focal contacts revealed by anti-vinculin antibody, (Actin) F-actin detected by TRITC-conjugated phalloidin and (Merge) merged stain of DAPI, phalloidin and vinculin. Images are representative of 3 independent experiments. Scale bar = 50 μm. (H and I) Assessment of spheroid formation in HGSOC cells treated with DMSO or 1 μM BDP9066 for 72 hrs. Representative images of HGSOC cell spheroids (H) from 3 independent biological replicates. Scale bar = 1000 μm. (I) Quantitation of spheroid density determined by ImageJ. *P≤0.05 by Student’s t-test. (J) Model of the mechanism, depicting the integral role of MRCKA in promoting proliferation, migration and survival of HGSOC cells, thus highlighting MRCKA as new kinase inhibitor target for the treatment of HGSOC. Related data (knockdown of MRCKB’s impact on HGSOC cell viability, drug synergy studies involving BDP9066 and carboplatin or PAK1 inhibitors, as well as quantitation of number of focal contacts in KURAMOCHI cells in response to BDP9066) can be found in figure S6.
