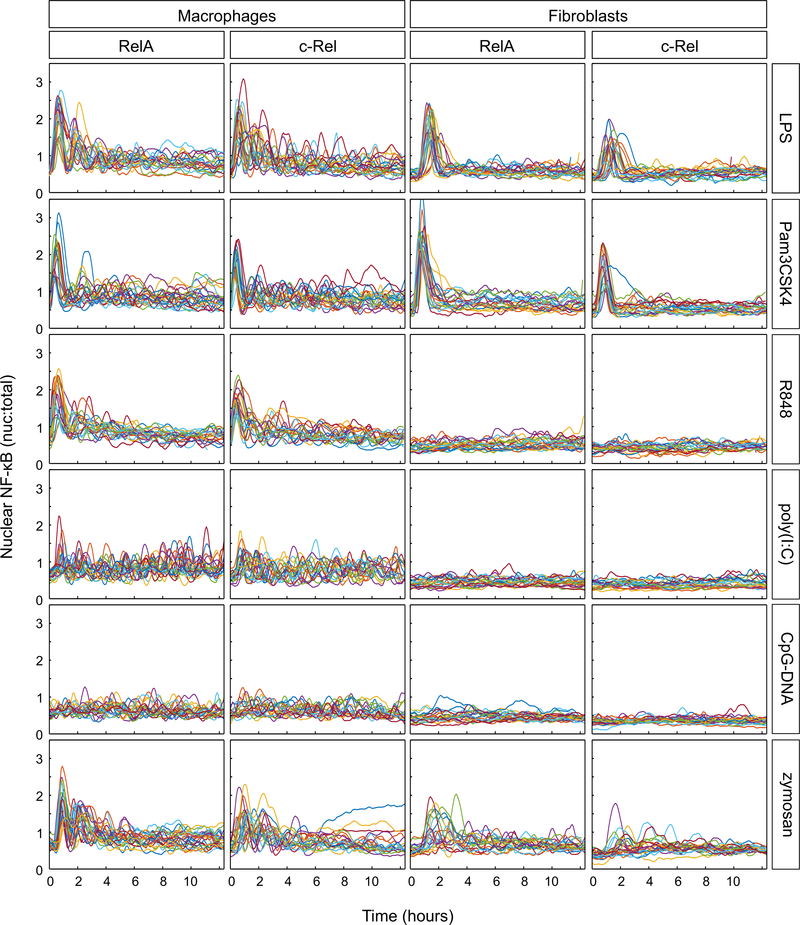
Fig. 2. TLR ligand–induced NF-κB dynamics in single cells.
Macrophages and fibroblasts stably expressing fluorescent RelA or c-Rel fusion proteins were treated with the indicated TLR ligands and imaged for approximately 12.5 hours. Ratios of nuclear-to-total (nuc:total) cellular fluorescence of RelA and c-Rel were calculated and plotted. Ligand concentrations were carefully chosen from the reference literature, where available. The concentrations of TLR ligands used were as follows: LPS (10 ng/ml); Pam3CSK4 (40 ng/ml); R848 (1 μM; 350 ng/ml); poly(I:C) (20 μg/ml); CpG-DNA (25 μg/ml); zymosan (5 μg/ml); flagellin and profilin (250 ng/ml). n ≥ 20 cells for each ligand and NF-κB subunit, in each cell type. Results were obtained from at least two independent experiments per ligand, NF-κB subunit, and cell type.

