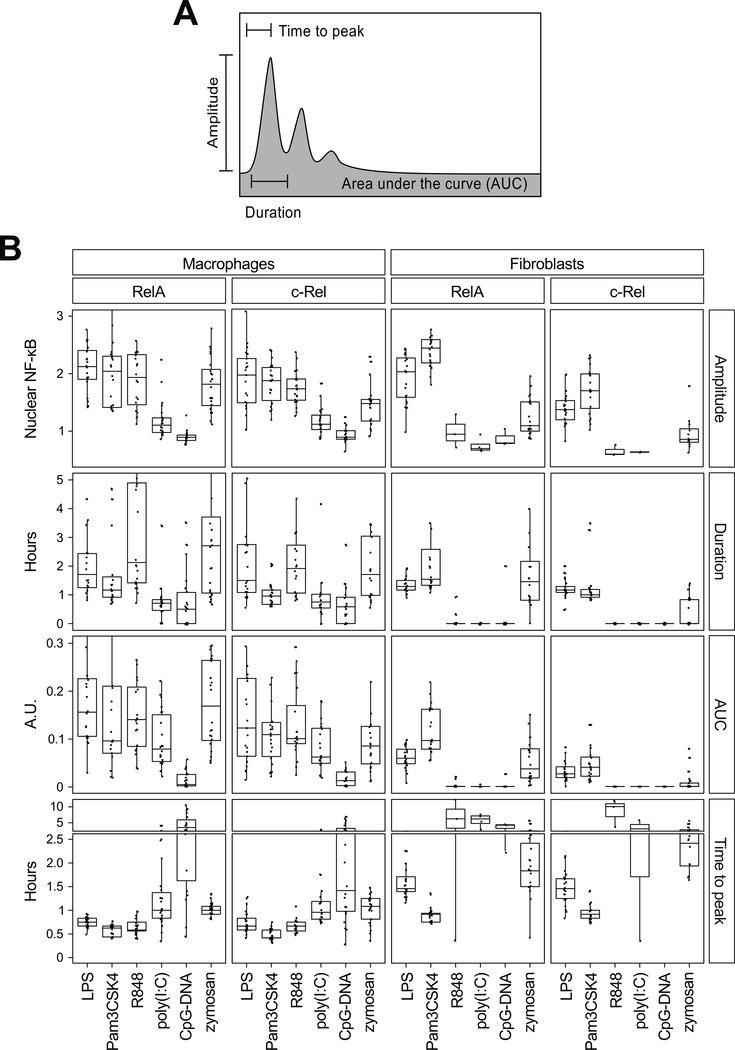
Fig. 3. Quantification of TLR ligand–induced NF-κB dynamics.
(A) Features of NF-κB signaling dynamics that were analyzed. (B) Quantification of the single-cell RelA and c-Rel dynamics induced by the six TLR ligands that induced responses in either cell type (from the data in Fig. 2). The median value of each dynamic feature is depicted with quartile ranges. One-way ANOVA was performed to measure statistical significance amongst groups, whereas the Mann–Whitney test was performed for pairwise comparisons. Statistical test results can be found in table S1. AUC, area under the curve; A.U., arbitrary units.

