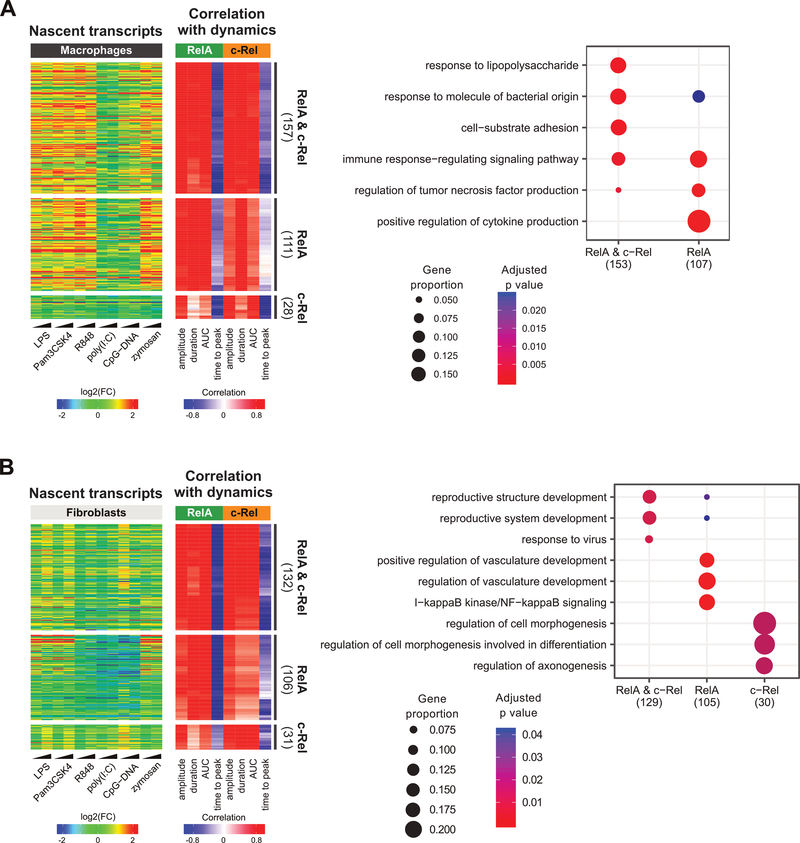
Fig. 6. Subunit-specific correlation analysis.
(A and B) For macrophages (A) and fibroblasts (B), genes from clusters E to G were classified based on the average strength of correlation to RelA and c-Rel dynamic features (see Materials and Methods). Display schemes are the same as those used in Fig. 5. Right: GOBP enrichment analysis of dynamics-correlated genes in each gene subset in the heatmap. The three most statistically significant GOBP terms for each set were merged and the combined GOBP terms are listed in the plot. The number of genes with GOBP annotations are indicated in parentheses. Significant terms are marked as dots. Dot size represents the proportion of cluster genes annotated for each term. P values were adjusted using the default Benjamini-Hochberg method.

