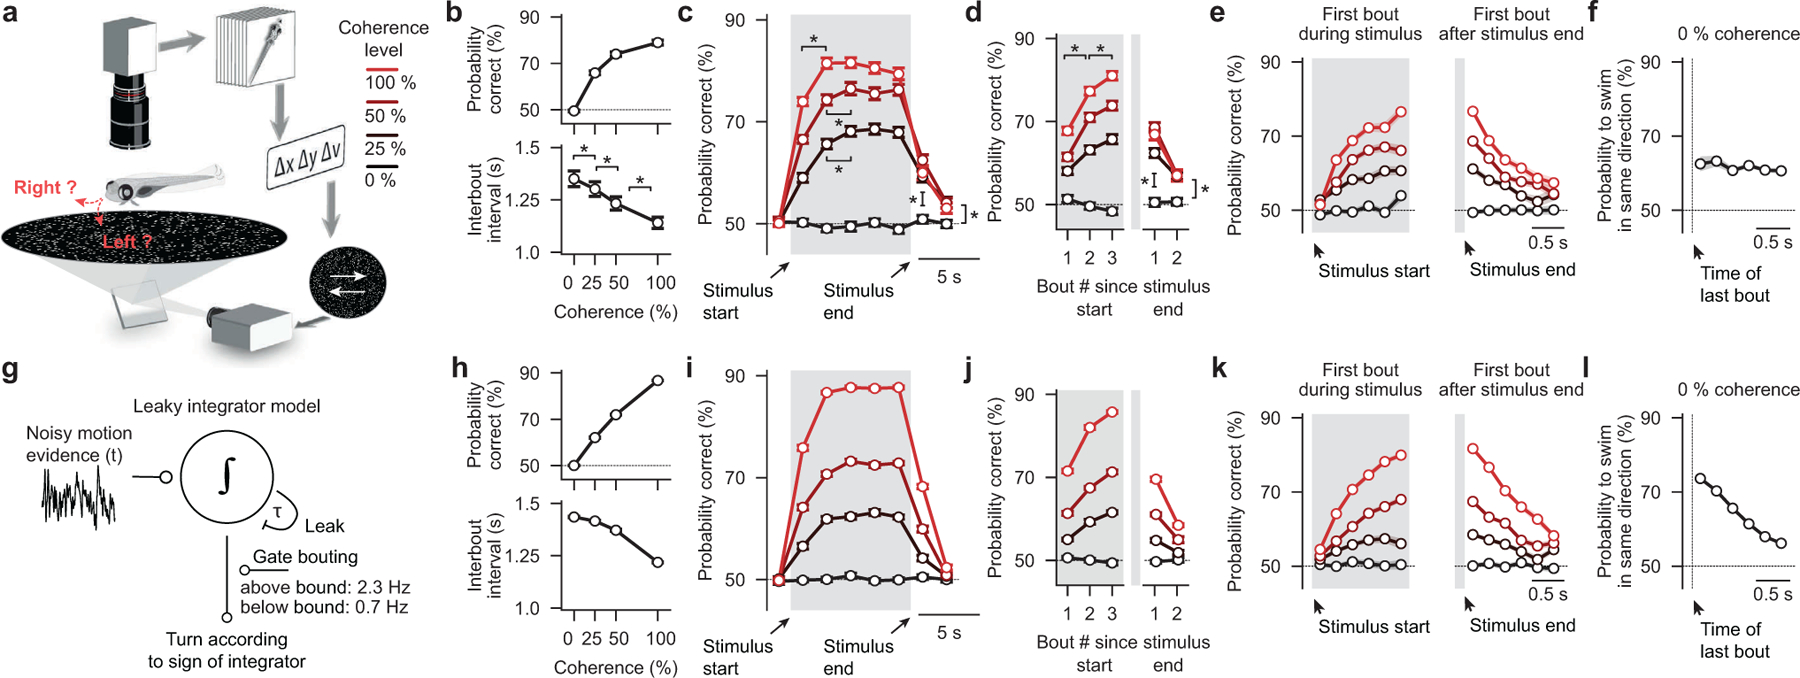
Figure 1 |. Behavior and modeling in freely swimming larval zebrafish.

a, Random dot motion kinematograms presented from below to freely swimming larval zebrafish. After a few seconds of 0 % coherence (baseline stimulus, no motion, flickering dots), a certain percentage of the dots starts to move coherently either left- or right-ward at a constant speed until we switch coherence levels back to 0 %. Each dot, whether it is moving or not, has a lifetime of a few hundred milliseconds, making it impossible for larvae to track individual dots over the time course of the trial. The system operates in closed-loop so that dots always move perpendicularly to the fish no matter where animals are located and how they are oriented in the arena. Note that sizes are not to scale (the body length a larval zebrafish at this age is ~4 mm, the diameter of the visual arena is 12 cm). b, Accuracy and interbout interval as a function of coherence strength. c, Time-binned accuracy as a function of time (first bin during motion: *p < 0.001 for all coherence levels; second bin during motion: p = 0.9, *p < 0.05, *p < 0.01, for 100 %, 50 %, 25 % coherence level, respectively; first bin after stimulus: *p < 0.001 for all coherence levels; second bin after stimulus: *p < 0.05, *p < 0.01, *p < 0.01, for 100 %, 50 %, 25 % coherence level, respectively). d, Accuracy over consecutive bouts (first to second bout after stimulus start: *p < 0.001, for all coherences; second to third bout after stimulus start: *p < 0.001, *p < 0.01, *p < 0.05, for 100 %, 50 %, 25 % coherence level, respectively; first and second bout relative to 0 % control: *p < 0.001, for all coherences). e, Accuracy of the first bout during the stimulus and the first bout after the stimulus end as a function of delay. f, Probability to swim in the same direction as a function of interbout interval during 0 % coherence. g, Schematic of the bounded leaky integrator model. h–l, Quantification of model simulation results as in (b–f). N = 60 fish in (b–d,f) and N = 56 fish in (e). N = 16 model runs in (h–l). Gray shaded areas in (c–e,i–k) indicate time of motion coherence presentation, before and after coherence levels are at 0 %. All error bars are mean ± sem over fish. P-values are based on one-sided t-tests comparing response differences to zero. All asterisks (*) indicate significance (*p < 0.05, *p < 0.01, or *p < 0.001).
