
Figure 4 |. Neural correlates of behavioral choices in the anterior hindbrain.
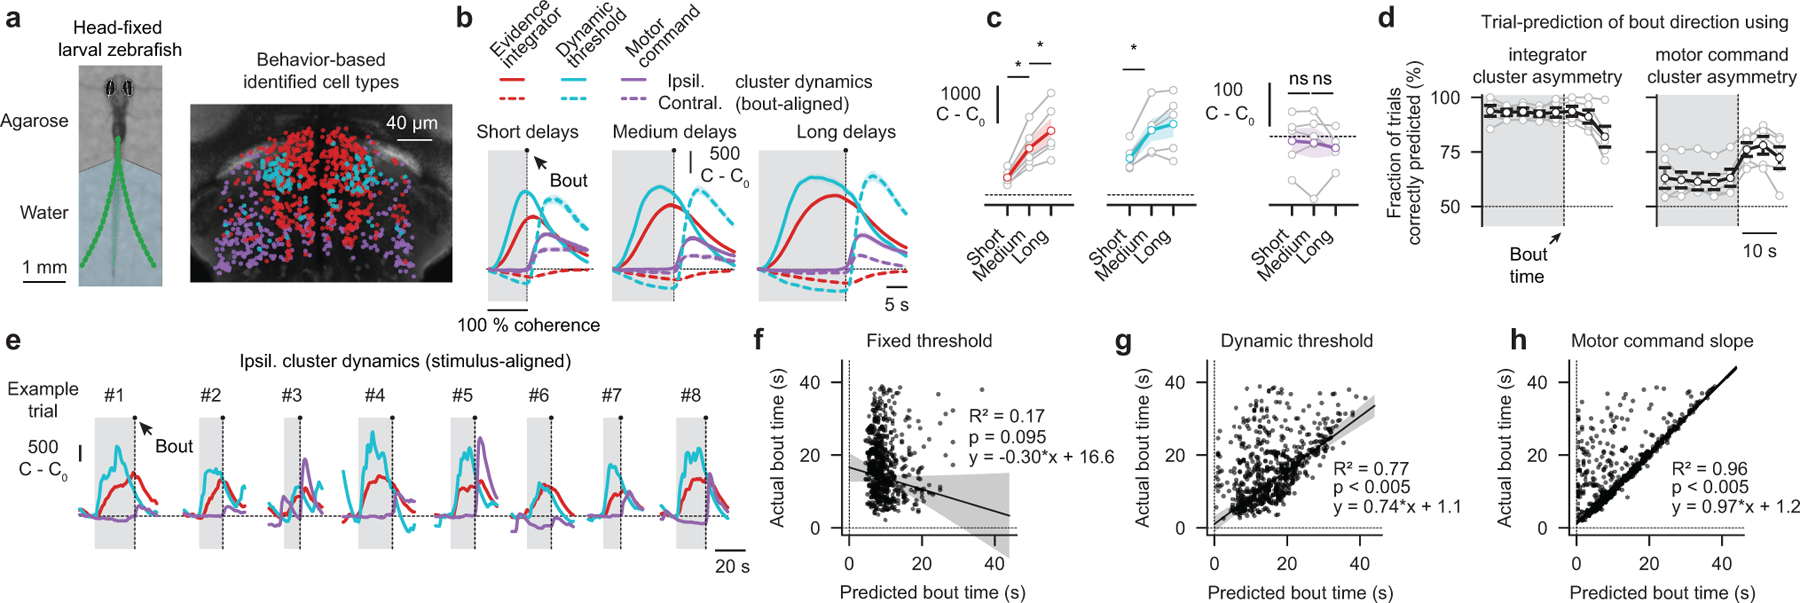
a, Photograph of a head-fixed larval zebrafish in the two-photon microscope (left panel). Green dots indicate tail tracking points. In each trial, we presented 0 % coherence as a baseline, followed by left- or right-ward moving 100 % coherence until the animal initiated a swim bout. Whenever we detected such an event, we immediately dropped coherence levels to 0 %, which was necessary to prevent vigorous movements and struggles. We used a behavior-based classification approach to determine the functional identity of cell types (right panel). b, Experimentally obtained bout-aligned cluster averages, grouped by response delay (short: 4–10 s, medium: 10–16 s long: 16–22 s). Ipsilateral indicates the left or the right hemisphere for left- or right-ward motion, respectively, contralateral the other side. Gray shaded areas indicate motion stimulation. c, Quantification of ipsilateral cluster activity at bout time as a function of delay (*p < 0.01 for both integrator cluster comparisons; *p < 0.05 for the dynamic threshold cluster comparison; p = 0.72 and p = 0.61 for the motor command cluster comparisons). See Extended Data Fig. 6b,c for model simulations. d, Trial-to-trial prediction of swimming direction, based on the integrator or motor command cluster dynamics, as a function of time relative to bout. e, Example trials of stimulus-aligned ipsilateral cluster dynamics. f,g,h, Trial-to-trial bout time predictions (black dots indicate individual bouts) based on three threshold models and respective robust linear regression analyses (RANSAC, see methods). Gray shaded areas indicate confidence intervals of the regression fits. N = 5 fish in (a–d,f–h) and N = 1 fish in (e). Gray lines with open circles in (c,d) are individual fish, colored or black lines in (c,d) are fish averages. All error bars indicate mean ± sem over trials (b) or fish (c,d). P-values in (c) are based on one-sided t-tests comparing response differences to zero. All asterisks (*) indicate significance (*p < 0.05, *p < 0.01, or *p < 0.001).