
Extended Data Fig. 4. Detailed quantification of responsive brain areas identified during brain-wide calcium imaging.
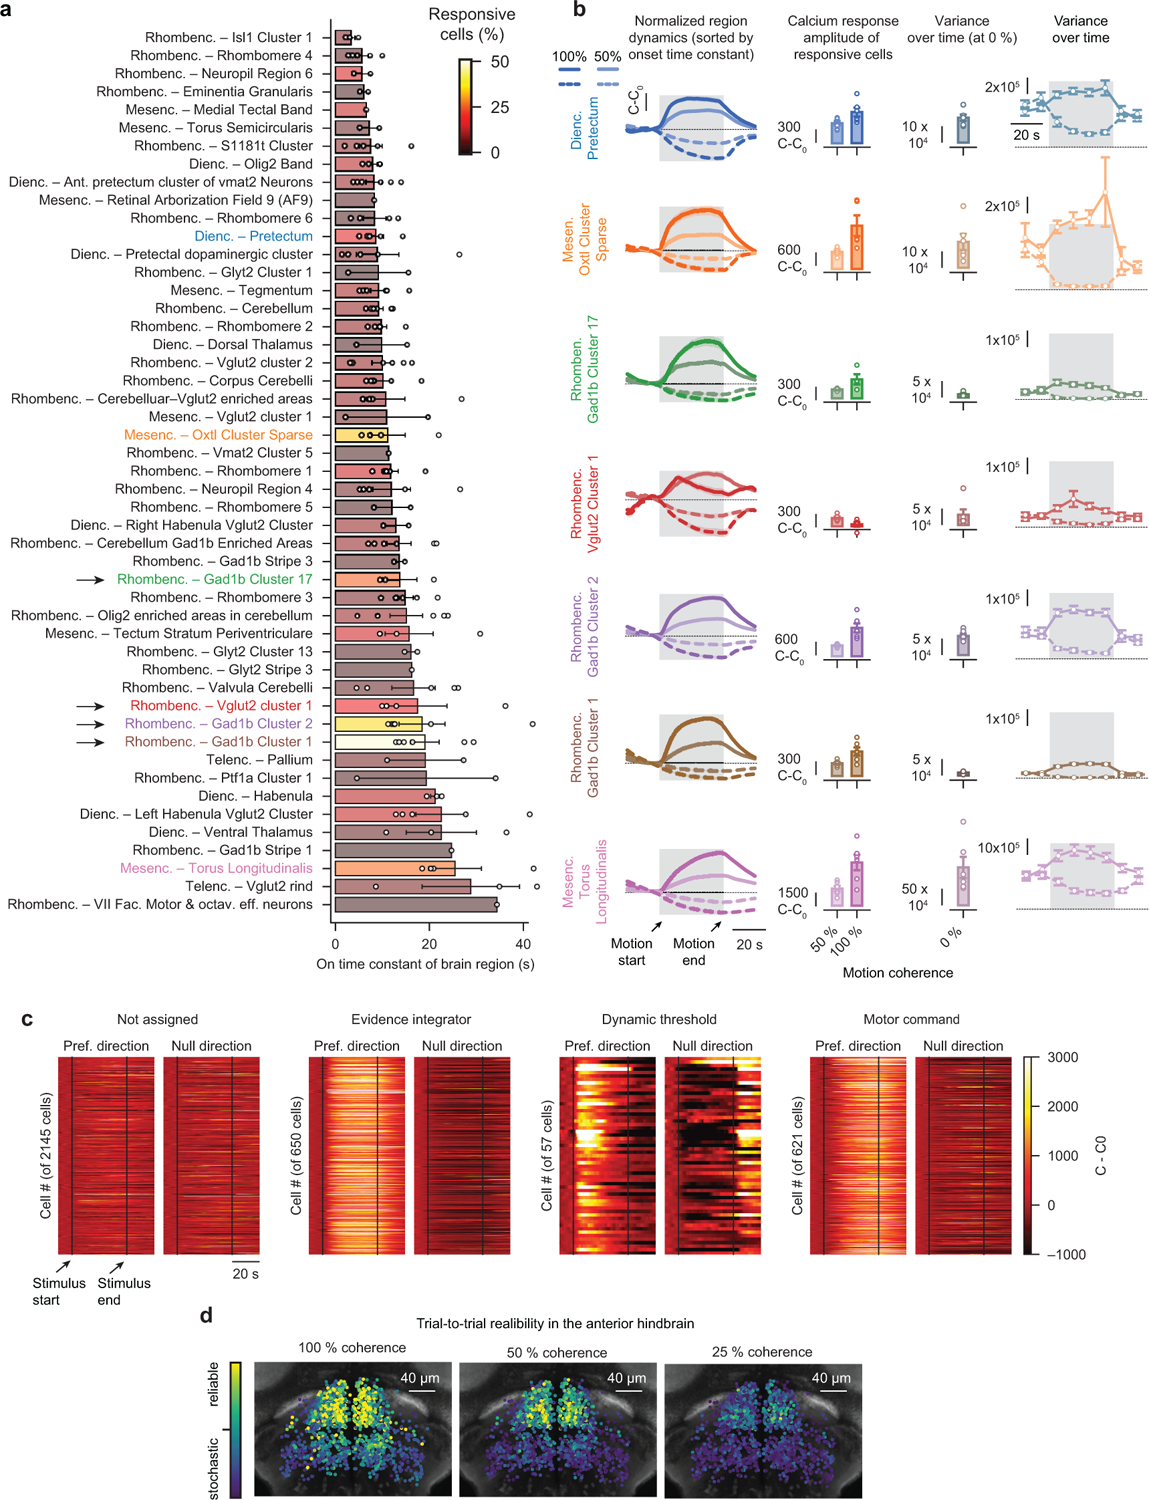
a, All brain areas with >1 % responsive cells, sorted by fitted onset time constant during 50 % coherent motion. Text label colors relate to colors in (b) and Fig. 3c,d. Bar colors represent fraction of responsive cells within a brain region. Black arrows indicate anterior hindbrain regions with slow dynamics and a large fraction of responsive cells. b, Brain areas with >15% responsive cells sorted by temporal dynamics (top, fast; bottom, slow) characterized from left to right. Column 1: Peak-normalized calcium dynamics, relative to baseline (C0) averaged over all cells responding to coherent motion in preferred- (PD) or null-direction (ND), respectively. Column 2: Average (last 5 s of coherent motion) calcium response amplitude (comparisons between 50 % and 100 %, from top to bottom: p = 0.05, p = 0.06, p = 0.16, p < 0.05, p < 0.01, p < 0.05, p < 0.05). Column 3: Variance (over time), calculated in individual cells and trials, then averaged, during 0 % coherence Column 4: Same as column 3 but time-binned for region’s preferred- and null-direction. As variances for preferred- and null-direction motion quickly converge after motion stimulation, the last time bin reflects a motion-memory independent variance at 0 % coherence. c, Preferred- and null-direction dynamics of all identified anterior hindbrain cells functionally clustered by regressor analysis (Fig. 3e). Preferred motion direction refers to motion to the left or right for cells in the left or right hemisphere, respectively, null-direction motion the other way around. d, Spatial arrangement of trial-to-trial reliability for all cells without functional clustering, as in Fig. 3g but for all three coherence levels. N = 6 fish for 50 % and N = 6 fish for 100 % motion coherence stimulation in (a,b). Open circles in (a,b) indicate individual fish. Note that in some fish not all brain areas were imaged and, hence, fish number per brain regions is variable. N = 6 fish in (c,d). All error bars in (a,b) indicate mean ± sem over fish. Shaded gray areas in (b) and dashed vertical lines in (c) indicate motion stimulation. Before and after 0 % coherence is shown. All p-values are based on two-sided t-tests.